
Even before the COVID-19 pandemic, the world was already off-track to achieve its education targets. An estimated 84 million children and young people will still be out of school and an estimated 300 million students will still not have the basic numeracy and literacy skills they need to succeed in life. To deliver on Goal 4, education systems must be reimagined, and education financing must become a priority national investment.
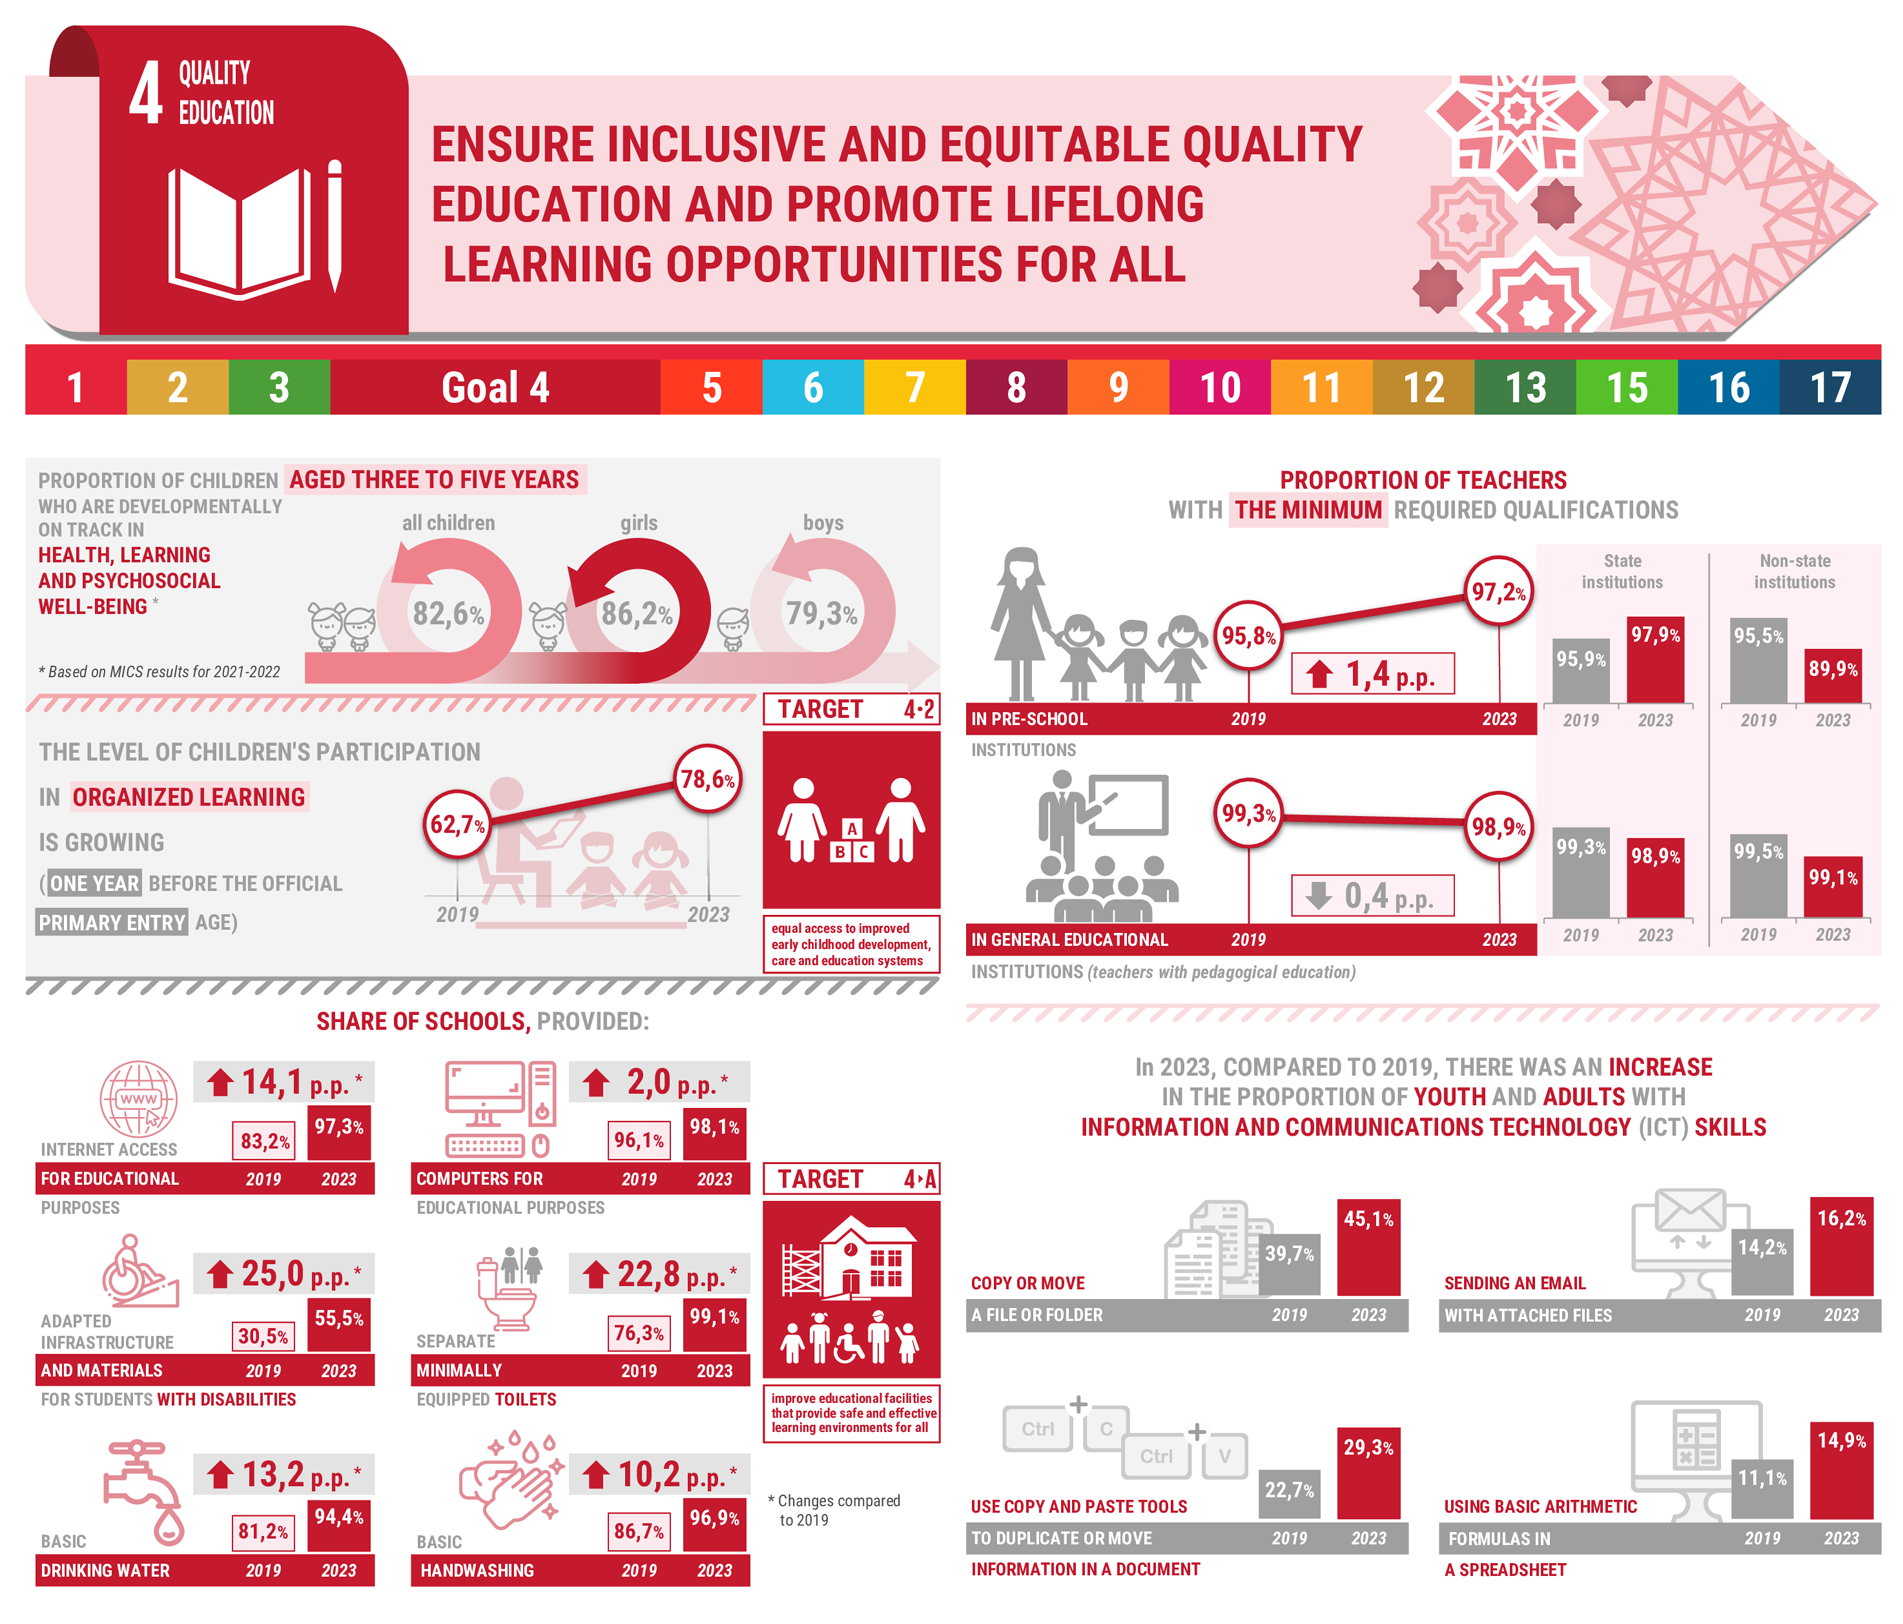
The participation rate in organized learning one year before the official primary entry age has stagnated at around 75 per cent, still far from the target of ensuring that all girls and boys have access to quality pre-primary education by 2030.
Basic school infrastructure is far from universal. Approximately one quarter of primary schools globally did not have access to basic services, such as electricity, drinking water and basic sanitation facilities.
Globally, over 14 per cent of teachers were still not qualified according to national norms, with little improvement since 2015.
A key target for SDG 4 is to maintain universal access and improve the quality of education at all levels. Since 1991, the coverage of primary and general secondary education in Uzbekistan has been consistently high at the level of 98-99.8 percent. In turn, if the coverage of children with preschool education in 2011 was 18.2 percent, then in 2020 this figure increased to 50.9 percent. Also, the share of teachers with higher pedagogical education in general education institutions increased from 94.2 percent in 2011 to 99.1 percent n 2020. In addition, one can observe an increase in the share of teachers with a teacher education in preschool education from 95 percent in 2011 to 98.3 percent in 2020. At the same time, a high level of literacy is maintained and a significant increase in academic performance in secondary education is ensured.
In turn, enrollment in higher education lags significantly behind the performance of countries with similar levels of development. With regard to the coverage in higher education of the population aged 25 and over, despite the fact that this indicator in 2011-2020 increased from 14.4 percent to 16.5 percent, Uzbekistan also lags behind the countries of the region and the world and is currently planning gradually expand coverage.
National Tasks
Target 4.1. By 2030, raise the primary and secondary education to a qualitatively new level leading to relevant and effective learning outcomes while maintaining universal coverage.
Target 4.2. By 2030, ensure that all girls and boys have access to quality early childhood development, care and pre‑primary education so that they are ready for primary education.
Target 4.3. By 2030, ensure equal access for all women and men to affordable and quality secondary special, tertiary, vocational and additional education.
Target 4.4. By 2030, substantially increase the number of youth and adults who have relevant skills, including technical and vocational skills, for employment, decent jobs and entrepreneurship.
Target 4.5. Ensure equal access to all levels of education and vocational training for the persons with disabilities by upgrading educational facilities to make them for children with disabilities safe, and providing safe and effective learning environments for all.
Target 4.7. By 2030, ensure that all learners and students acquire the knowledge and skills needed to promote sustainable development.
Target 4.а. Upgrade education facilities to provide safe and effective learning environments for all.
Target 4.b. By 2030, take measures to increase the number of loans and grants, including international ones, for enrolment in higher education programmes.
Target 4.с. By 2030, substantially increase the supply of qualified teachers (lecturers), including through international cooperation for training, re-training and in-service training of teachers and lecturers.
National indicators
| NATIONAL INDICATORS | 2000 | 2001 | 2002 | 2003 | 2004 | 2005 | 2006 | 2007 | 2008 | 2009 | 2010 | 2011 | 2012 | 2013 | 2014 | 2015 | 2016 | 2017 | 2018 | 2019 | 2020 | 2021 | 2022 | 2023 | 2024 | |
| 1 | Indicator 4.2.1. Proportion of children aged three to five years who are developmentally on track in health, learning and psychosocial well-being, by sex: 1) | |||||||||||||||||||||||||
| a) all children; | - | - | - | - | - | - | - | - | - | - | - | - | - | - | - | - | - | - | - | - | - | - | 82.6 | - | - | |
| b) girls; | - | - | - | - | - | - | - | - | - | - | - | - | - | - | - | - | - | - | - | - | - | - | 86.2 | - | - | |
| с) boys. | - | - | - | - | - | - | - | - | - | - | - | - | - | - | - | - | - | - | - | - | - | - | 79.3 | - | - | |
| 2 | Indicator 4.2.2. Participation rate in organized learning (one year before the official primary entry age), by sex: | |||||||||||||||||||||||||
| a) all children; | 13.8 | 14.2 | 14.8 | 15.1 | 15.7 | 15.5 | 16.5 | 20.8 | 18.9 | 19.7 | 18 | 18.6 | 22.4 | 20.5 | 21.8 | 21.9 | 29.7 | 30.8 | 40.6 | 62.7 | 68.0 | 75.1 | 84.2 | 78.6 | 95.4 | |
| b) girls; | - | - | - | - | - | - | - | 20.9 | 18.9 | 19.7 | 17.8 | 18.4 | 22.6 | 19.8 | 20.1 | 21.6 | 28.8 | 30.6 | 39.8 | 62.6 | 68.5 | 76.4 | 83.4 | 70.6 | 92.5 | |
| с) boys. | - | - | - | - | - | - | - | 20.6 | 18.8 | 19.7 | 18.2 | 18.7 | 19.5 | 21.2 | 21.5 | 22.6 | 30.5 | 31.0 | 41.2 | 62.8 | 67.5 | 73.9 | 85.0 | 86.1 | 98.7 | |
| 3 | Indicator 4.4.1. Proportion of youth and adults with information and communications technology (ICT) skills, by type of skill: | |||||||||||||||||||||||||
| Copy or move a file or folder; | - | - | - | - | - | - | - | - | - | - | - | - | - | - | - | - | - | 38.3 | 39.4 | 39.7 | 39.7 | 43.5 | 43.9 | 45.1 | 45.6 | |
| Use copy and paste tools to duplicate or move information in a document; | - | - | - | - | - | - | - | - | - | - | - | - | - | - | - | - | - | 19.3 | 22.4 | 22.7 | 23.3 | 23.6 | 24.1 | 29.3 | 31.5 | |
| Sending an email with attached files (such as a document, photo, video); | - | - | - | - | - | - | - | - | - | - | - | - | - | - | - | - | - | 13.8 | 14.1 | 14.2 | 15.2 | 15.6 | 15.9 | 16.2 | 16.5 | |
| Using basic arithmetic formulas in a spreadsheet; | - | - | - | - | - | - | - | - | - | - | - | - | - | - | - | - | - | 10.0 | 10.5 | 11.1 | 14.0 | 14.4 | 14.7 | 14.9 | 15.1 | |
| Connecting and installing new devices (e.g. modem, camera, printer); | - | - | - | - | - | - | - | - | - | - | - | - | - | - | - | - | - | 4.8 | 5.4 | 5.5 | 4.8 | 6.8 | 7.2 | 7.5 | 8.0 | |
| Search, download, install, and configure software; | - | - | - | - | - | - | - | - | - | - | - | - | - | - | - | - | - | 4.5 | 4.6 | 4.6 | 5.1 | 5.4 | 5.8 | 6.3 | 6.9 | |
| Create electronic presentations with presentation software (including images, sound, video, or diagrams); | - | - | - | - | - | - | - | - | - | - | - | - | - | - | - | - | - | 5.7 | 6.7 | 6.8 | 7.2 | 7.4 | 7.8 | 8.4 | 7.7 | |
| Transfer files between your computer and other devices; | - | - | - | - | - | - | - | - | - | - | - | - | - | - | - | - | - | 4.3 | 4.4 | 4.7 | 5.0 | 5.8 | 6.7 | 9.1 | 9.6 | |
| Creation of a computer program using a special programming language. | - | - | - | - | - | - | - | - | - | - | - | - | - | - | - | - | - | 0.0 | 0.0 | 0.1 | 0.2 | 1.2 | 1.4 | 2.6 | 2.7 | |
| including the proportion of youth aged 15-24: | ||||||||||||||||||||||||||
| Copy or move a file or folder; | - | - | - | - | - | - | - | - | - | - | - | - | - | - | - | - | - | 56.6 | 56.8 | 59.5 | 59.5 | 58.1 | 62.5 | 70.2 | 71.1 | |
| Use copy and paste tools to duplicate or move information in a document; | - | - | - | - | - | - | - | - | - | - | - | - | - | - | - | - | - | 27.5 | 36.4 | 36.3 | 36.0 | 38.3 | 40.0 | 51.0 | 54.7 | |
| Sending an email with attached files (such as a document, photo, video); | - | - | - | - | - | - | - | - | - | - | - | - | - | - | - | - | - | 19.6 | 19.2 | 21.1 | 22.0 | 19.4 | 18.6 | 23.2 | 25.6 | |
| Using basic arithmetic formulas in a spreadsheet; | - | - | - | - | - | - | - | - | - | - | - | - | - | - | - | - | - | 16.2 | 19.7 | 18.6 | 20.5 | 20.5 | 26.0 | 25.4 | 27.5 | |
| Connecting and installing new devices (e.g. modem, camera, printer); | - | - | - | - | - | - | - | - | - | - | - | - | - | - | - | - | - | 8.7 | 7.7 | 8.6 | 7.1 | 7.2 | 14.8 | 10.6 | 10.0 | |
| Search, download, install, and configure software; | - | - | - | - | - | - | - | - | - | - | - | - | - | - | - | - | - | 7.2 | 6.7 | 7.1 | 6.9 | 6.4 | 9.9 | 8.4 | 8.2 | |
| Create electronic presentations with presentation software (including images, sound, video, or diagrams); | - | - | - | - | - | - | - | - | - | - | - | - | - | - | - | - | - | 11.4 | 14.4 | 10.7 | 11.9 | 11.5 | 14.2 | 15.8 | 15.5 | |
| Transfer files between your computer and other devices; | - | - | - | - | - | - | - | - | - | - | - | - | - | - | - | - | - | 6.6 | 8.8 | 7.4 | 7.9 | 8.9 | 11.4 | 15.7 | 15.4 | |
| Creation of a computer program using a special programming language. | - | - | - | - | - | - | - | - | - | - | - | - | - | - | - | - | - | 0.0 | 0.0 | 0.3 | 0.3 | 1.7 | 2.6 | 4.4 | 3.7 | |
| 4 | Indicator 4.5.1. Parity indices (rural and urban, welfare rate) in education system: | |||||||||||||||||||||||||
| a) total; | - | - | - | - | - | - | - | - | - | - | - | - | - | - | - | - | - | 0.92 | 0.93 | 0.92 | 0.92 | 0.92 | 0.93 | 0.94 | 0.92 | |
| b) urban; | - | - | - | - | - | - | - | - | - | - | - | - | - | - | - | - | - | 0.91 | 0.94 | 0.93 | 0.93 | 0.91 | 0.91 | 0.96 | 0.94 | |
| c) rural; | - | - | - | - | - | - | - | - | - | - | - | - | - | - | - | - | - | 0.92 | 0.92 | 0.92 | 0.92 | 0.93 | 0.95 | 0.93 | 0.91 | |
| 1 quintile; | - | - | - | - | - | - | - | - | - | - | - | - | - | - | - | - | - | 0.92 | 0.92 | 0.92 | 1.07 | 1.03 | 1.03 | 1.05 | 1.04 | |
| 2 quintile; | - | - | - | - | - | - | - | - | - | - | - | - | - | - | - | - | - | 0.97 | 0.96 | 0.96 | 0.91 | 0.96 | 0.97 | 0.96 | 0.95 | |
| 3 quintile; | - | - | - | - | - | - | - | - | - | - | - | - | - | - | - | - | - | 0.90 | 0.88 | 0.89 | 0.90 | 0.90 | 0.89 | 0.99 | 0.88 | |
| 4 quintile; | - | - | - | - | - | - | - | - | - | - | - | - | - | - | - | - | - | 0.88 | 0.89 | 0.90 | 0.93 | 0.87 | 0.88 | 0.87 | 0.91 | |
| 5 quintile. | - | - | - | - | - | - | - | - | - | - | - | - | - | - | - | - | - | 0.78 | 0.78 | 0.79 | 0.78 | 0.84 | 0.86 | 0.85 | 0.82 | |
| 5 | Indicator 4.a.1. Proportion of schools provided: | |||||||||||||||||||||||||
| a) electricity; | 100 | 100 | 100 | 100 | 100 | 100 | 100 | 100 | 100 | 100 | 100 | 100 | 100 | 100 | 100 | 100 | 100 | 100 | 100.0 | 100.0 | 100.0 | 100.0 | 100.0 | 100.0 | 100.0 | |
| b) Internet access for educational purposes; 2) | - | - | - | - | - | - | - | - | - | - | - | - | - | - | - | - | - | 87.9 | 86.3 | 83.2 | 78.7 | 92.5 | 94.9 | 97.3 | 99.9 | |
| c) computers for educational purposes; | - | - | - | - | - | - | - | - | - | - | - | - | - | - | - | - | - | 87.3 | 97.0 | 96.1 | 97.5 | 97.7 | 97.7 | 98.1 | 99.9 | |
| d) adapted infrastructure and materials for students with disabilities; | - | - | - | - | - | - | - | - | - | - | - | - | - | - | - | - | - | - | 26.5 | 30.5 | 32.4 | 38.0 | 49.8 | 55.5 | 99.9 | |
| e) basic drinking water; | - | - | - | - | - | - | - | - | - | - | - | - | - | - | - | - | - | 34.4 | 79.6 | 81.2 | 83.0 | 86.5 | 88.1 | 94.4 | 99.9 | |
| f) separate minimally equipped toilets; | - | - | - | - | - | - | - | - | - | - | - | - | - | - | - | - | - | 15.4 | 73.3 | 76.3 | 78.9 | 81.3 | 86.6 | 99.1 | 98.3 | |
| g) basic handwashing. | - | - | - | - | - | - | - | - | - | - | - | - | - | - | - | - | - | 59.0 | 84.2 | 86.7 | 89.5 | 90.9 | 91.1 | 96.9 | 99.9 | |
| 6 | Indicator 4.c.1. Proportion of teachers with the minimum required qualifications, by education level: | |||||||||||||||||||||||||
| 1. Pre-school institutions: 3) | - | - | - | - | - | - | - | - | 95.3 | 95.2 | 94.7 | 95.0 | 98.5 | 96.3 | 95.9 | 97.0 | 98.0 | 98.4 | 95.6 | 95.8 | 98.3 | 98.8 | 96.1 | 97.2 | 97.9 | |
| a) state institutions; | - | - | - | - | - | - | - | - | - | - | - | - | - | - | - | - | - | - | - | 95.9 | 98.6 | 99.0 | 97.2 | 97.9 | 99.0 | |
| b) non-state institutions. | - | - | - | - | - | - | - | - | - | - | - | - | - | - | - | - | - | - | - | 95.5 | 95.9 | 96.3 | 87.4 | 89.9 | 95.6 | |
| 2. Educational institutions with teacher education: | - | - | - | - | - | - | - | - | - | - | 90.2 | 94.2 | 95.2 | 93.5 | 96.6 | 97.4 | 98.8 | 99.0 | 99.4 | 99.3 | 99.1 | 99.0 | 99.0 | 98.9 | 98.8 | |
| a) state institutions; | - | - | - | - | - | - | - | - | - | - | - | - | - | - | - | - | - | - | - | 99.3 | 99.1 | 99.0 | 99.0 | 98.9 | 98.9 | |
| b) non-state institutions. | - | - | - | - | - | - | - | - | - | - | - | - | - | - | - | - | - | - | - | 99.5 | 98.3 | 92.5 | 94.3 | 99.1 | 94.0 |
1) MICS survey results
2) 2017-2019 proportion of schools with access to "ZiyoNet"
3) 2008-2017 the share of teachers with secondary specialized pedagogical education in the total number of teachers with secondary specialized education