
The pandemic has caused major shifts in migration patterns, including huge movements of people in and out of urban areas. Furthermore, climate change and conflicts tend to have disproportionate impacts on cities. These factors mean that the world is far from achieving the goal of sustainable cities. In many developing countries, slum populations have been growing, putting at risk the target. Since 2015, the number of countries with national disaster risk reduction strategies has more than doubled. To achieve Goal 11, efforts must focus on strengthening capacities for planning urban development, improving access to public transportation and enhancing waste management.
As of 2020, nearly 1.1 billion people lived in slums or slum-like conditions in urban areas, with an additional 2 billion expected to live in slums or slum-like conditions over the next 30 years.
According to 2020 data from 1,507 cities in 126 countries, only 51.6 per cent of the world’s urban population has convenient access to public transport, with considerable variations across regions.
According to the State Committee of the Republic of Uzbekistan on Statistics, since 2001 to 2021, the share of the urban population increased from 37.2 percent to 50.7 percent. The republic has 35 cities with a population of more than 100 thousand inhabitants and 3 cities with a population of more than 500 thousand inhabitants. These are Tashkent (2,694.4 thousand), Namangan (644.8 thousand) and Samarkand (551.7 thousand).
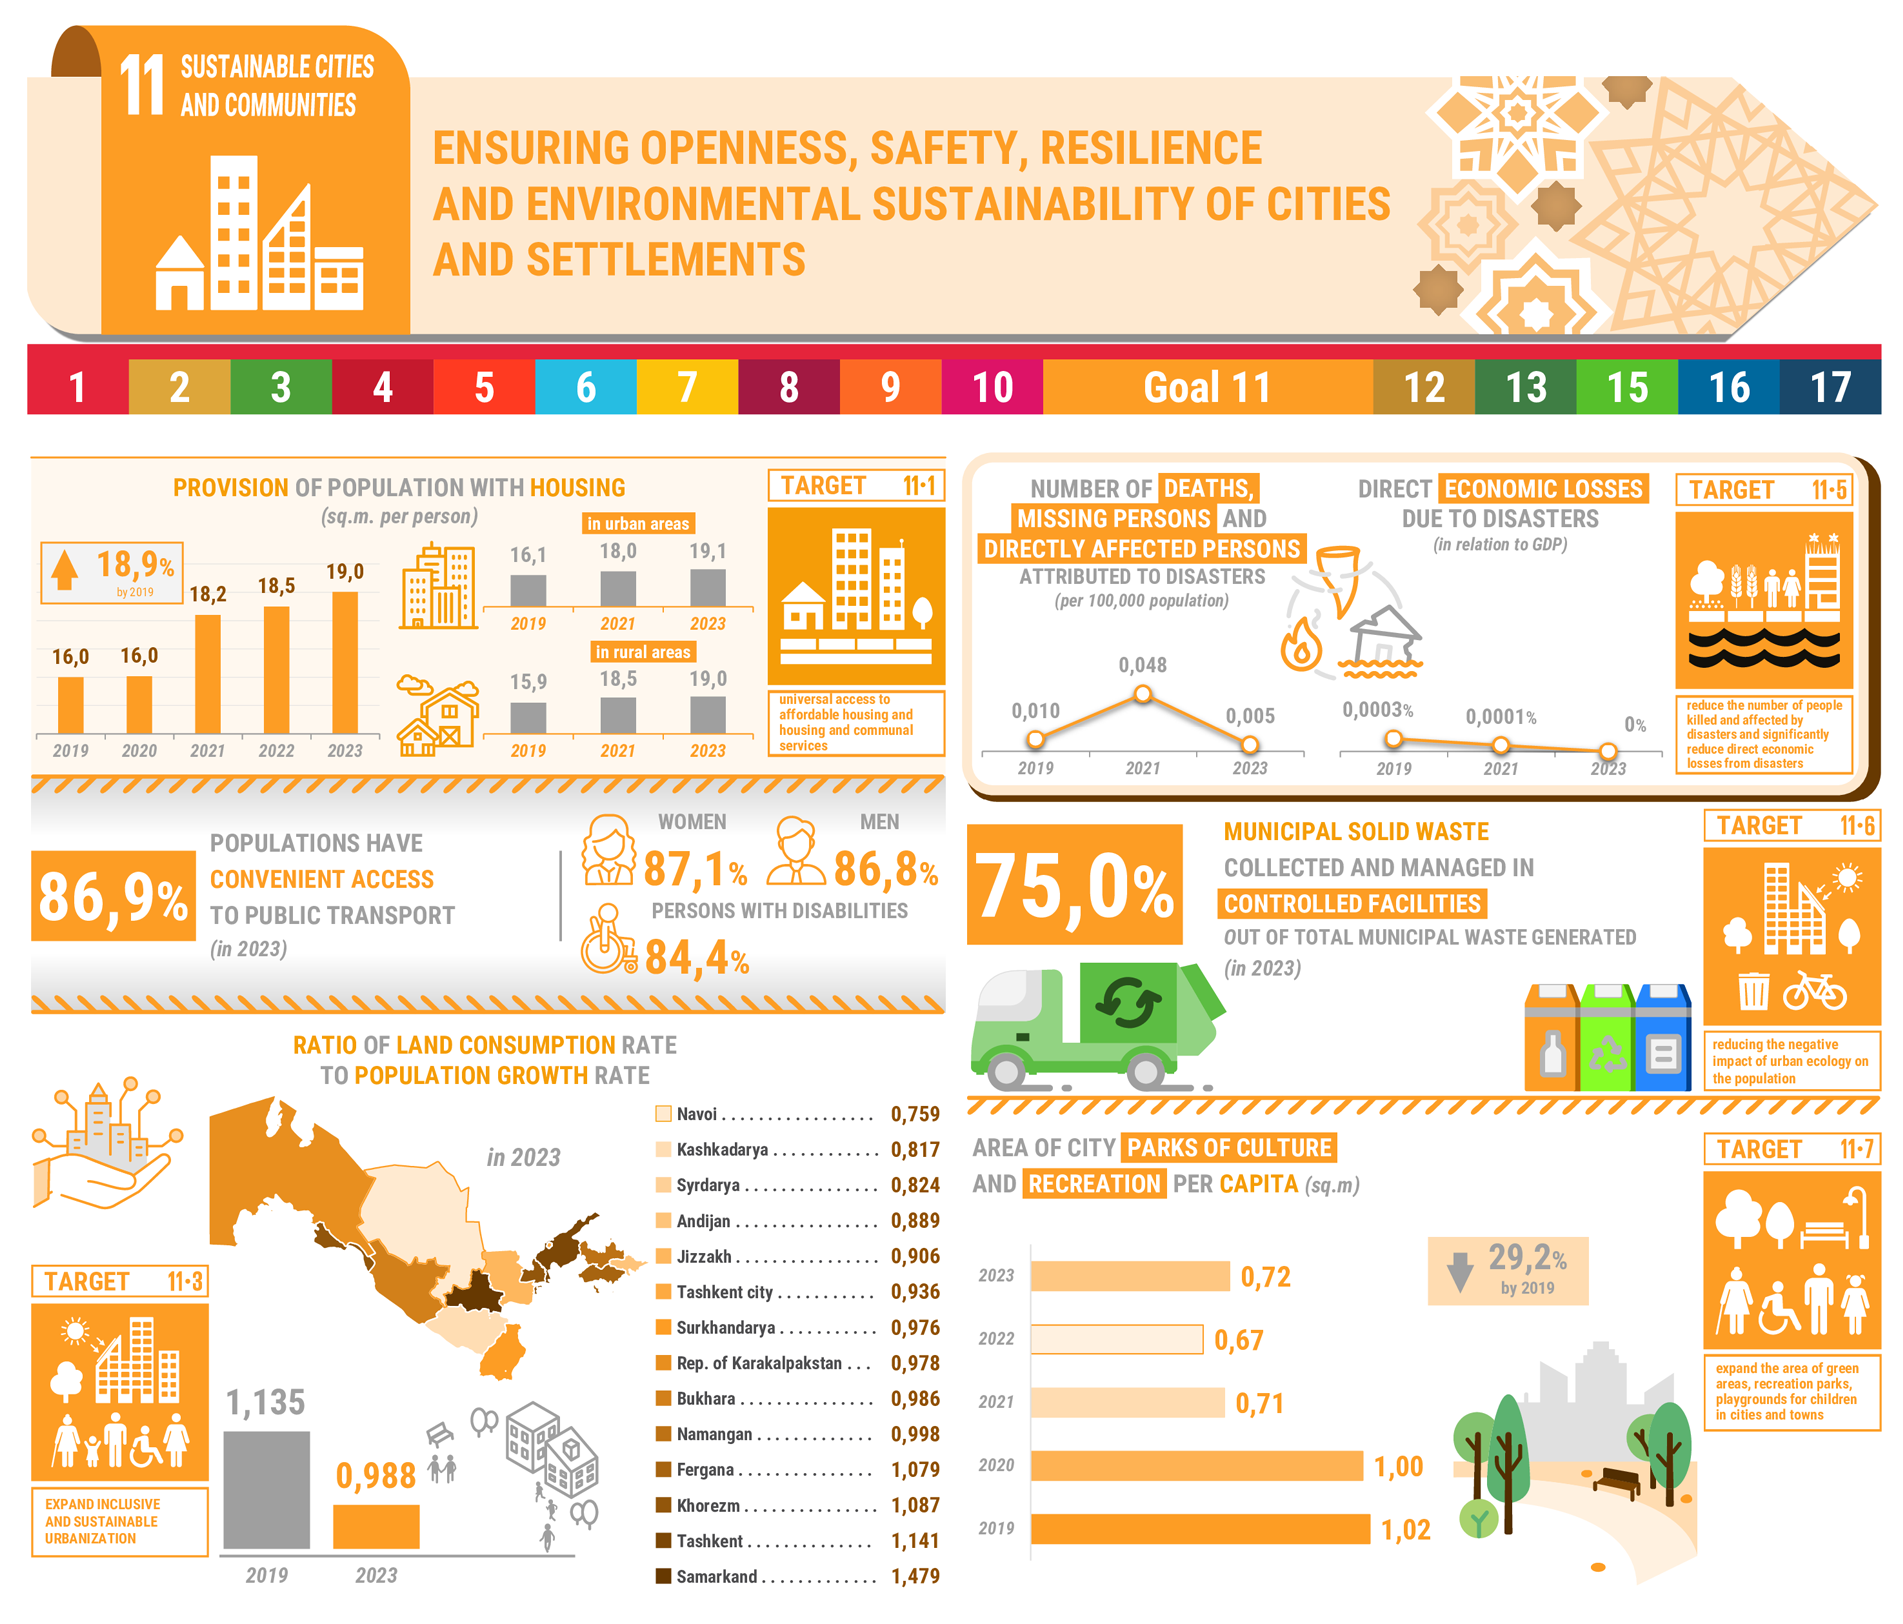
On the other hand, in 2011-2020, the area of city parks of culture and recreation per capita decreased from 1.22 m2 to 1 m2.
In the future, in Uzbekistan, the solution of the issues of resilience and security will be connected with the solution of the tasks of ensuring access of the population, including the poor, to quality housing with the proper infrastructure, as well as ensuring the environmental sustainability of cities and towns.
The relevance of the goal is due to the fact that Uzbekistan aims to continue the process of industrialization of the economy. Industrialization, as the experience of other countries shows, is usually accompanied by the development of the urbanization process, an increase in the load on the infrastructure of cities, especially the largest economic centers, and aggravation of various social problems.
To minimize (ideally, completely eliminate) the impact of the problems posed by the urbanization process, Uzbekistan is already implementing a set of programs to ensure balanced development, including by stimulating the development of regional centers and small towns, expanding and modernizing social, engineering and communication infrastructure. In the long term, there is the task of further improving the mechanisms for managing settlements and ensuring balanced spatial development of the country.
National Tasks
Target 11.1. By 2030, ensure universal access to affordable housing and housing and utilities services.
Target 11.2. By 2030, provide access to safe, affordable, accessible and sustainable transport systems, improving road safety, notably by expanding public transport, with special attention to the needs of people in vulnerable situations.
Target 11.3. By 2030, enhance inclusive and sustainable urbanization and capacity for participatory, integrated and sustainable human settlement planning and management.
Target 11.4. Strengthen efforts to protect and safeguard objects of cultural and natural heritage.
Target 11.5. By 2030, significantly reduce the number of deaths and the number of people affected by disasters, especially women and children, and substantially decrease the direct economic losses caused by disasters with a focus on protecting people in vulnerable situations.
Target 11.6. By 2030, reduce the adverse environmental impact of cities on population, including by paying special attention to air quality and municipal and other waste management.
Target 11.7. By 2030, expand the areas of green spaces, recreational parks, playgrounds for children in cities and towns, and make them inclusive and accessible for persons with disabilities.
National indicators
| NATIONAL INDICATORS | 2000 | 2001 | 2002 | 2003 | 2004 | 2005 | 2006 | 2007 | 2008 | 2009 | 2010 | 2011 | 2012 | 2013 | 2014 | 2015 | 2016 | 2017 | 2018 | 2019 | 2020 | 2021 | 2022 | 2023 | 2024 | |
| 1 | Indicator 11.1.1.1. Provision of population with housing (sq.m. per person): | 13.8 | 14.0 | 14.3 | 14.3 | 14.4 | 14.5 | 14.6 | 14.6 | 14.8 | 14.9 | 15.0 | 15.0 | 15.0 | 15.1 | 15.2 | 15.2 | 15.4 | 15.7 | 15.8 | 16.0 | 16.0 | 18.2 | 18.5 | 19.0 | 18.9 |
| а) in urban areas; | 14.6 | 14.9 | 15.0 | 14.9 | 15.1 | 15.1 | 15.3 | 15.3 | 14.8 | 15.1 | 15.4 | 15.4 | 15.4 | 15.3 | 15.4 | 15.4 | 15.4 | 15.8 | 16.0 | 16.1 | 16.1 | 18.0 | 18.2 | 19.1 | 19.1 | |
| b) in rural areas. | 13.3 | 13.5 | 13.8 | 13.9 | 14.1 | 14.2 | 14.2 | 14.3 | 14.9 | 14.6 | 14.5 | 14.5 | 14.5 | 14.9 | 14.9 | 15.0 | 15.4 | 15.5 | 15.7 | 15.9 | 16.0 | 18.5 | 18.7 | 19.0 | 18.7 | |
| Republic of Karakalpakstan | - | - | - | - | - | - | - | - | - | - | - | - | - | - | - | - | - | 19.2 | 18.9 | 16.6 | 16.5 | 16.7 | 17.1 | 17.4 | 17.6 | |
| regions: | ||||||||||||||||||||||||||
| Andijan | - | - | - | - | - | - | - | - | - | - | - | - | - | - | - | - | - | 10.4 | 10.4 | 10.3 | 10.3 | 13.9 | 15.7 | 15.7 | 15.8 | |
| Bukhara | - | - | - | - | - | - | - | - | - | - | - | - | - | - | - | - | - | 14.8 | 15.9 | 16.9 | 17.4 | 17.5 | 17.4 | 17.4 | 17.2 | |
| Jizzakh | - | - | - | - | - | - | - | - | - | - | - | - | - | - | - | - | - | 13.9 | 13.9 | 14.1 | 14.3 | 17.0 | 17.0 | 17.7 | 17.4 | |
| Kashkadarya | - | - | - | - | - | - | - | - | - | - | - | - | - | - | - | - | - | 16.2 | 16.7 | 16.9 | 16.7 | 16.5 | 16.6 | 16.7 | 16.4 | |
| Navoi | - | - | - | - | - | - | - | - | - | - | - | - | - | - | - | - | - | 21.8 | 22.0 | 22.4 | 22.4 | 23.8 | 24.0 | 26.5 | 27.4 | |
| Namangan | - | - | - | - | - | - | - | - | - | - | - | - | - | - | - | - | - | 15.1 | 15.2 | 16.0 | 16.5 | 17.0 | 17.0 | 16.8 | 16.6 | |
| Samarkand | - | - | - | - | - | - | - | - | - | - | - | - | - | - | - | - | - | 15.1 | 15.1 | 15.1 | 15.1 | 19.6 | 19.4 | 20.0 | 20.0 | |
| Surkhandarya | - | - | - | - | - | - | - | - | - | - | - | - | - | - | - | - | - | 12.7 | 12.7 | 12.7 | 12.8 | 13.9 | 13.7 | 13.5 | 13.4 | |
| Syrdarya | - | - | - | - | - | - | - | - | - | - | - | - | - | - | - | - | - | 14.3 | 14.8 | 15.5 | 15.4 | 18.9 | 18.8 | 19.9 | 19.8 | |
| Tashkent | - | - | - | - | - | - | - | - | - | - | - | - | - | - | - | - | - | 15.0 | 15.2 | 15.5 | 15.9 | 16.7 | 17.6 | 22.3 | 22.0 | |
| Fergana | - | - | - | - | - | - | - | - | - | - | - | - | - | - | - | - | - | 13.4 | 13.3 | 13.2 | 13.1 | 20.9 | 20.8 | 20.6 | 20.1 | |
| Khorezm | - | - | - | - | - | - | - | - | - | - | - | - | - | - | - | - | - | 24.0 | 23.9 | 24.5 | 24.3 | 24.3 | 24.1 | 24.0 | 24.1 | |
| Tashkent city | - | - | - | - | - | - | - | - | - | - | - | - | - | - | - | - | - | 21.0 | 21.4 | 22.3 | 22.0 | 22.3 | 22.8 | 22.8 | 22.9 | |
| 2 | Indicator 11.2.1. Proportion of population that has convenient access to public transport, by sex, age and persons with disabilities: 1) | |||||||||||||||||||||||||
| a) total; | 65.3 | 68.7 | 69.5 | 70.6 | 73.8 | 73.4 | 77.3 | 76.6 | 77.6 | 77.6 | 78.3 | 79.8 | 83.4 | 84.8 | 82.5 | 82.9 | 83.9 | 84.9 | 84.0 | 87.1 | 86.4 | - | 87.4 | 86.9 | 90.5 | |
| b) women; | 65.5 | 69.0 | 70.0 | 70.9 | 74.4 | 74.0 | 77.7 | 77.1 | 77.7 | 77.7 | 78.7 | 80.1 | 83.3 | 85.1 | 82.6 | 83.1 | 84.2 | 85.0 | 84.9 | 87.3 | 86.9 | - | 87.6 | 87.1 | 90.4 | |
| c) men; | 65.1 | 68.4 | 69.1 | 70.4 | 73.3 | 72.8 | 77.0 | 76.2 | 77.4 | 77.6 | 77.9 | 79.5 | 83.6 | 84.5 | 82.4 | 82.8 | 83.7 | 84.8 | 83.2 | 86.8 | 86.0 | - | 87.1 | 86.8 | 90.6 | |
| d) persons with disabilities. | - | - | - | - | - | - | - | - | - | - | - | - | - | - | - | - | - | - | - | - | - | - | 86.4 | 84.4 | 89.1 | |
| 3 | Indicator 11.3.1. Ratio of land consumption rate to population growth rate. | 1.014 | 0.876 | 1.056 | 0.881 | 0.906 | 0.968 | 1.063 | 1.057 | 1.024 | 1.035 | 1.122 | 1.011 | 1.110 | 1.020 | 1.045 | 1.037 | 0.920 | 0.999 | 1.149 | 1.135 | 0.872 | 1.070 | 1.019 | 0.988 | 1.027 |
| Republic of Karakalpakstan | 0.992 | 0.980 | 0.944 | 1.048 | 1.010 | 0.762 | 1.030 | 1.135 | 1.160 | 1.123 | 1.057 | 1.342 | 1.276 | 0.939 | 1.007 | 0.972 | 0.766 | 1.166 | 1.220 | 1.425 | 0.701 | 1.048 | 1.112 | 0.978 | 1.004 | |
| regions: | ||||||||||||||||||||||||||
| Andijan | 0.925 | 0.869 | 0.996 | 1.003 | 1.035 | 0.948 | 1.018 | 1.049 | 1.024 | 1.105 | 1.137 | 0.994 | 0.898 | 1.190 | 1.035 | 0.953 | 1.062 | 0.961 | 1.315 | 1.059 | 1.171 | 0.861 | 1.052 | 0.889 | 1.126 | |
| Bukhara | 0.994 | 0.989 | 0.990 | 0.995 | 0.992 | 1.007 | 1.007 | 1.052 | 1.005 | 1.001 | 1.156 | 0.942 | 1.074 | 0.998 | 1.047 | 1.066 | 0.967 | 1.036 | 1.525 | 1.001 | 1.031 | 1.016 | 1.101 | 0.986 | 0.991 | |
| Jizzakh | 1.012 | 1.026 | 1.002 | 0.995 | 1.000 | 0.924 | 1.009 | 1.053 | 1.063 | 0.999 | 1.161 | 0.959 | 1.059 | 1.041 | 1.039 | 0.920 | 1.224 | 0.817 | 1.129 | 0.970 | 0.815 | 0.959 | 1.062 | 0.906 | 0.961 | |
| Kashkadarya | 0.968 | 0.988 | 1.011 | 0.986 | 0.979 | 0.989 | 0.987 | 1.017 | 0.964 | 0.970 | 1.048 | 0.993 | 0.983 | 1.005 | 1.013 | 1.082 | 1.059 | 1.039 | 0.977 | 0.877 | 0.972 | 1.012 | 1.152 | 0.817 | 1.014 | |
| Navoi | 1.094 | 0.991 | 1.105 | 0.985 | 1.029 | 1.050 | 0.977 | 0.978 | 1.000 | 1.190 | 1.090 | 1.414 | 0.910 | 1.054 | 1.117 | 1.076 | 0.990 | 1.040 | 1.068 | 1.261 | 0.725 | 1.245 | 1.044 | 0.759 | 1.025 | |
| Namangan | 1.021 | 1.004 | 1.040 | 0.978 | 0.852 | 1.243 | 0.980 | 1.111 | 1.000 | 1.043 | 1.084 | 0.986 | 1.134 | 0.899 | 1.092 | 0.998 | 1.075 | 0.916 | 1.087 | 1.372 | 0.952 | 1.063 | 0.998 | 0.998 | 1.006 | |
| Samarkand | 1.010 | 0.983 | 0.970 | 0.979 | 0.809 | 0.878 | 1.330 | 1.024 | 1.004 | 0.994 | 1.066 | 0.964 | 1.037 | 1.091 | 1.036 | 1.059 | 0.683 | 1.007 | 1.092 | 0.915 | 0.777 | 1.076 | 0.563 | 1.479 | 0.737 | |
| Surkhandarya | 1.084 | 0.753 | 0.969 | 0.817 | 0.855 | 0.903 | 1.031 | 1.085 | 1.012 | 1.020 | 1.273 | 0.985 | 1.086 | 1.047 | 0.968 | 1.098 | 0.984 | 0.860 | 1.094 | 0.926 | 1.100 | 1.067 | 0.984 | 0.976 | 0.993 | |
| Syrdarya | 1.048 | 0.982 | 1.042 | 0.992 | 0.969 | 0.806 | 1.234 | 1.049 | 1.054 | 1.062 | 1.237 | 0.887 | 1.096 | 0.968 | 0.745 | 0.836 | 0.829 | 0.887 | 0.858 | 1.698 | 1.712 | 0.315 | 0.717 | 0.824 | 1.861 | |
| Tashkent | 1.030 | 0.931 | 1.022 | 1.040 | 0.951 | 1.021 | 0.986 | 1.020 | 1.070 | 1.011 | 1.098 | 0.997 | 1.557 | 1.093 | 1.235 | 0.898 | 0.981 | 1.023 | 1.108 | 1.381 | 0.802 | 1.198 | 1.038 | 1.141 | 1.020 | |
| Fergana | 1.058 | 0.684 | 1.302 | 0.595 | 0.715 | 1.007 | 1.024 | 1.088 | 1.005 | 1.054 | 1.213 | 0.961 | 0.997 | 1.052 | 1.029 | 1.048 | 0.735 | 1.020 | 1.426 | 0.972 | 0.810 | 1.219 | 1.104 | 1.079 | 1.095 | |
| Khorezm | 1.082 | 0.913 | 1.088 | 0.610 | 1.002 | 0.955 | 1.249 | 1.061 | 1.051 | 1.006 | 1.085 | 0.990 | 1.178 | 0.935 | 1.047 | 1.206 | 0.961 | 0.984 | 0.852 | 0.918 | 0.985 | 1.448 | 1.033 | 1.087 | 1.078 | |
| Tashkent city | 0.817 | 0.622 | 1.270 | 0.931 | 0.795 | 0.972 | 1.056 | 1.094 | 1.107 | 1.110 | 1.039 | 1.024 | 1.647 | 0.963 | 1.119 | 1.213 | 0.710 | 1.314 | 1.266 | 1.622 | 0.414 | 1.407 | 0.941 | 0.936 | 1.114 | |
| 4 | Indicator 11.5.1. Number of deaths, missing persons and directly affected persons attributed to disasters per 100,000 population. | 0.04 | 0.04 | 0.02 | 0.11 | 0.03 | 0.06 | 0.03 | 0.01 | 0.04 | 0.05 | 0.05 | 0.23 | 0.04 | 0.02 | 0.00 | 0.06 | 0.06 | 0.03 | 0.03 | 0.01 | 0.11 | 0.048 | 0.047 | 0.005 | 0.003 |
| 5 | Indicator 11.5.2.1. Direct economic losses due to disasters as a percentage of GDP. | 0.460 | 0.310 | 0.034 | 0.019 | 0.004 | 0.004 | 0.003 | 0.009 | 0.004 | 0.004 | 0.002 | 0.008 | 0.006 | 0.037 | 0.000 | 0.000 | 0.003 | 0.000 | 0.002 | 0.000 | 0.024 | 0.000 | 0.005 | 0.000 | 0.000 |
| 6 | Indicator 11.6.1. Proportion of municipal solid waste collected and managed in controlled facilities out of total municipal waste generated, by cities. | - | - | - | - | - | - | - | - | - | - | - | - | - | - | - | - | - | - | - | - | - | - | 70.1 | 75.0 | 75.0 |
| 7 | Indicator 11.7.1.1. Area of city parks of culture and recreation per capita. | - | - | - | - | 1.10 | 1.03 | 0.99 | 0.99 | 0.59 | 0.75 | 1.22 | 1.22 | 1.27 | 1.15 | 1.18 | 1.18 | 1.14 | 1.10 | 1.04 | 1.02 | 1.00 | 0.71 | 0.67 | 0.73 | 0.72 |
18) This indicator is based on household survey questionnaires. And due to the improvement of questions about the possibility of convenient access to transport in the questionnaires, the indicator data for 2021 is in the process of formation (not calculated)