
The world is seriously off track in its effort to halve per-capita food waste and losses by 2030. The COVID-19 pandemic has had significant impacts on consumption and production patterns, with disruptions to global supply chains and changes in consumer behavior. Responsible consumption and production must be an integral part of the recovery from the pandemic. However, the global economy also needs to speed up the decoupling of economic growth from resource use by maximizing the socioeconomic benefits of resources while minimizing their negative impacts. To deliver Goal 12, it is crucial to implement policies that support the shift to sustainable practices and decouple economic growth from resource use.
The percentage of food lost globally after harvest at the farm, transport, storage, wholesale and processing levels, usually attributed to structural inadequacies in the countries, is estimated at 13.2 per cent in 2021, unchanged from 2016 and far from the target.
From year to year per capita, one can observe a growth trend in income, wages and pensions. On the other hand, there is an increase in demand for various products, the production of which requires already limited natural resources. It also leads to an increase in waste.
Uzbekistan annually produces 35 million cubic meters of household waste. This is approximately 254 thousand wagons. Each citizen of Uzbekistan produces about 165 kg of household waste every year. About 25 percent of the average trash can is food waste, 5-10 percent is paper, 50 percent is polymers, the rest is metal, textiles, rubber, glass and more.
In 2017-2020, the formation of toxic waste products of 1-3 hazard classes per capita increased from 0.7 percent to 10.6 percent. In turn, the level of processing of municipal solid waste over the same years increased from 9 percent to 21.9 percent.
The country's solid waste management systems are poorly equipped to meet current demand. Outside of Tashkent, only rudimentary waste management systems operate, the collected garbage is simply thrown into open landfills outside the village.
National Tasks
Target 12.1. Implement a ten-year strategy of action to transition to sustainable consumption and production patterns.
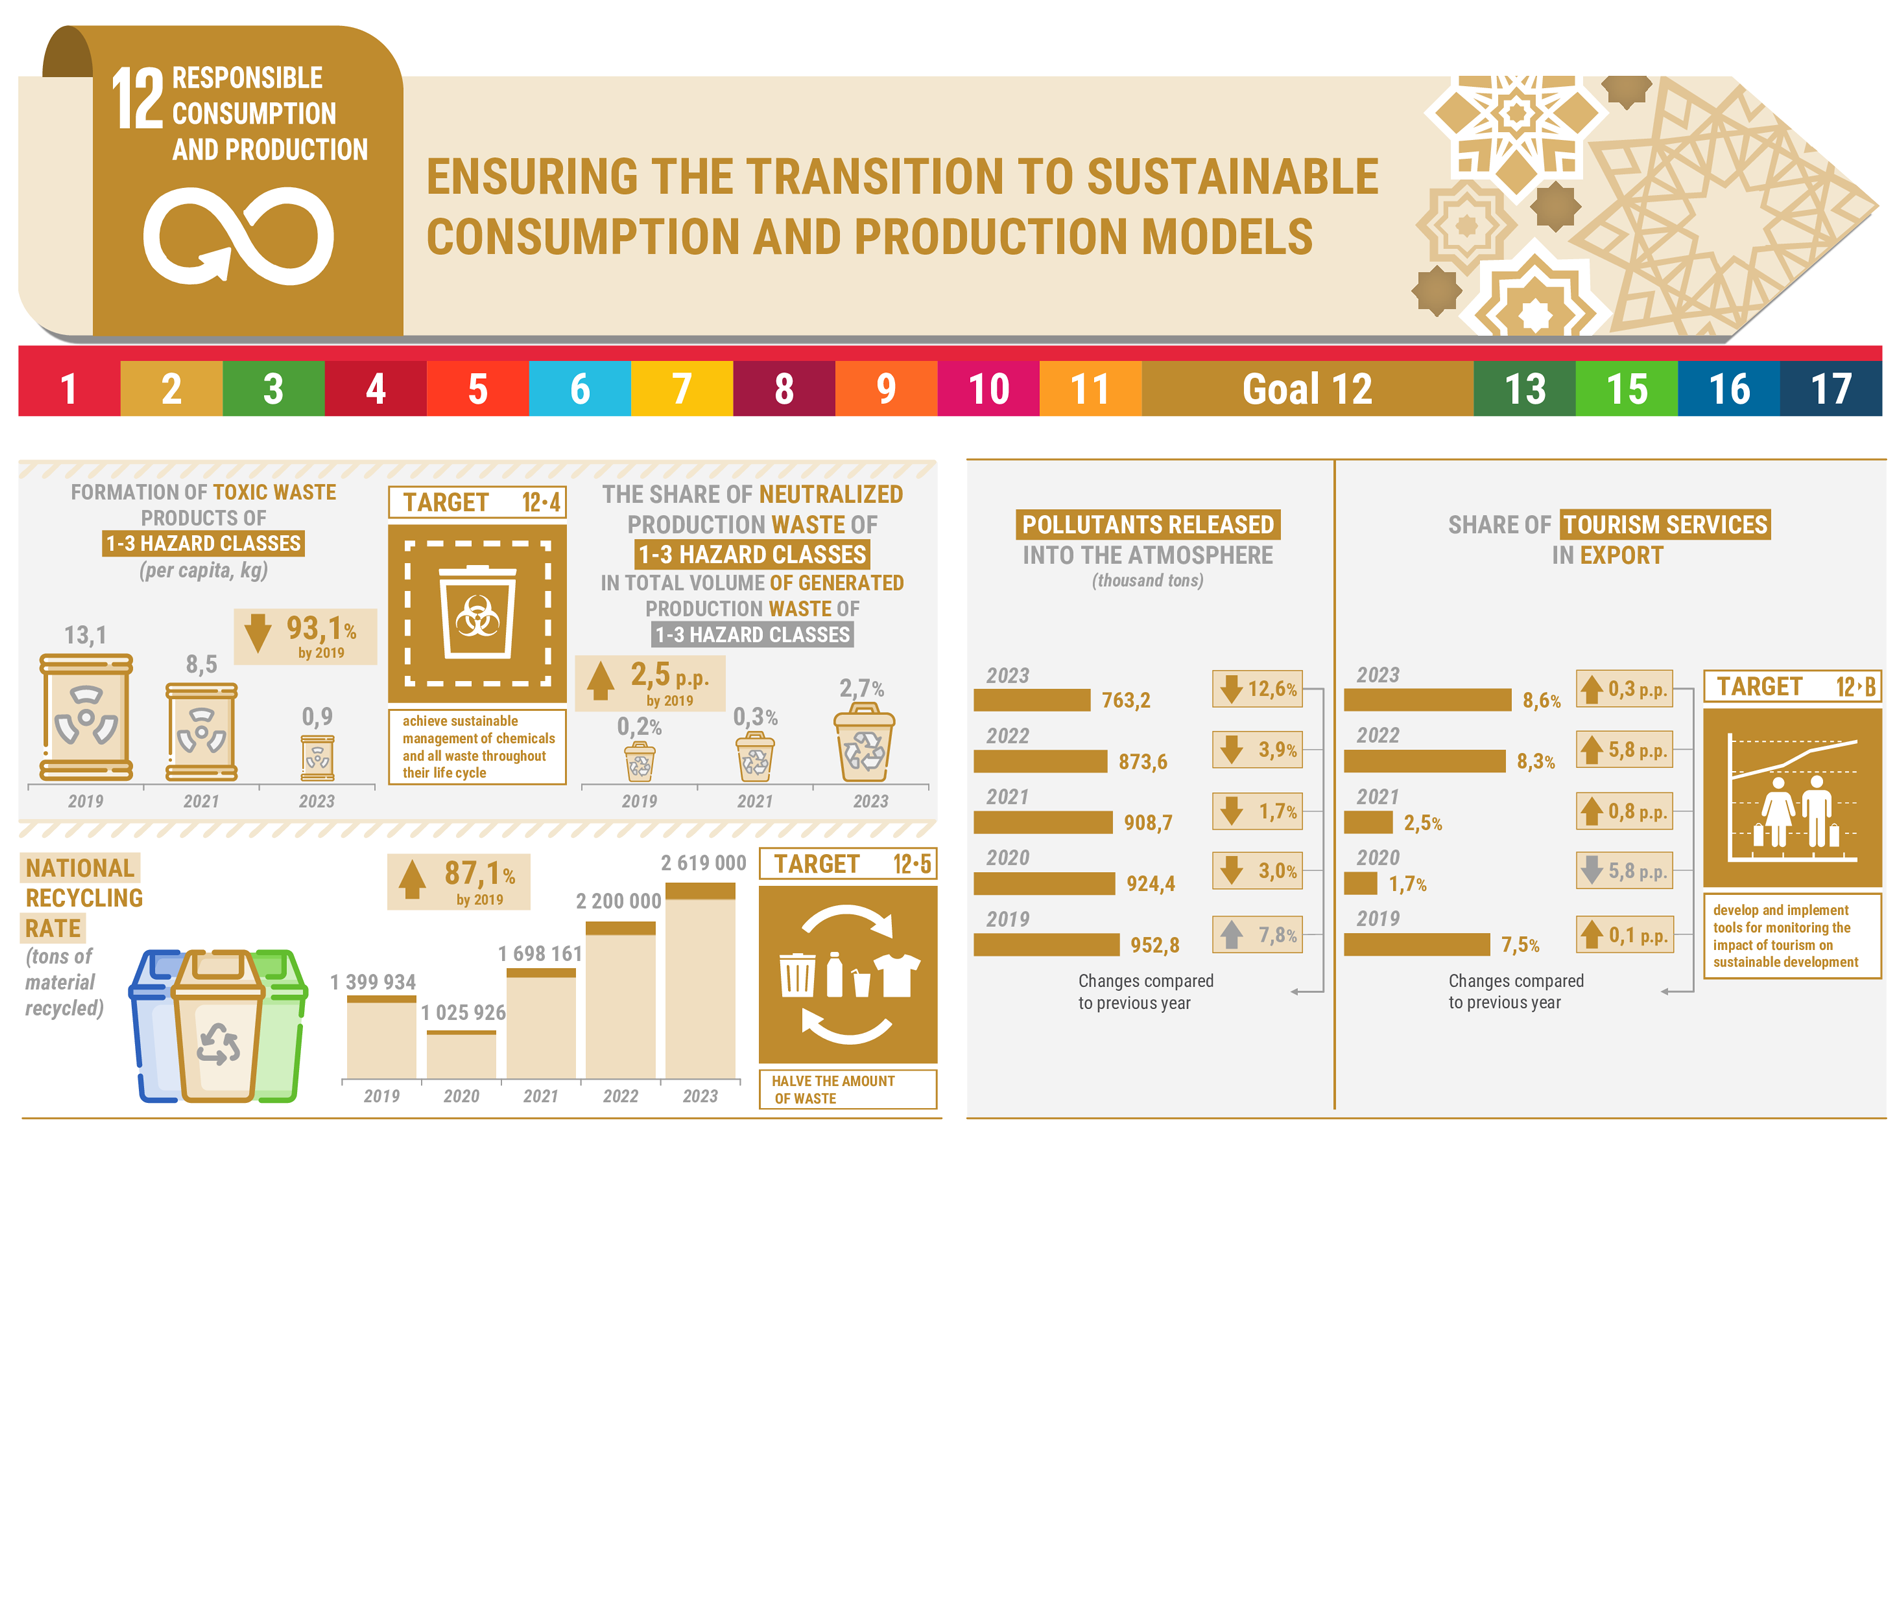
Target 12.4. By 2030, achieve the environmentally sound use of chemicals and all waste throughout their life cycle in accordance with agreed international principles, and reduce their release into the air, water and soil by half to minimize their negative impact on human health and the environment.
Target 12.5. By 2030, substantially reduce waste generation through prevention, reduction, recycling and reuse.
Target 12.6. Encourage companies, especially large and transnational companies, to adopt sustainable practices and to integrate sustainability information into their reporting cycle.
Target 12.7. Expand the use of environmental standards in public procurement practices.
Target 12.8. By 2030, ensure that people have the relevant information and awareness for sustainable development and lifestyle in harmony with nature.
Target 12.b. Develop and implement tools to monitor sustainable development impacts for sustainable tourism that creates jobs and promotes local culture and products.
Target 12.c. Rationalize inefficient fossil-fuel subsidies that encourage wasteful consumption by removing market distortions, in accordance with national circumstances, including by restructuring taxation and phasing out those harmful subsidies, where they exist, to reflect their environmental impacts, taking fully into account the specific needs and conditions of developing countries and minimizing the possible adverse impacts on their development in a manner that protects the poor and the affected communities.
National indicators
| NATIONAL INDICATORS | 2000 | 2001 | 2002 | 2003 | 2004 | 2005 | 2006 | 2007 | 2008 | 2009 | 2010 | 2011 | 2012 | 2013 | 2014 | 2015 | 2016 | 2017 | 2018 | 2019 | 2020 | 2021 | 2022 | 2023 | 2024 | |
| 1 | Indicator 12.4.1. Availability of international multilateral environmental agreements on hazardous waste, and other chemicals that meet their commitments and obligations in transmitting information as required by each relevant agreement. | - | - | - | - | - | - | - | - | - | - | - | - | - | - | - | - | - | - | - | 44.4 | 44.4 | 44.4 | 46.7 | 46.7 | 46.7 |
| 2 | Indicator 12.4.2.1. Formation of toxic waste products of 1-3 hazard classes per capita. | - | - | - | - | - | - | - | - | - | - | - | - | - | - | 0.8 | 0.7 | 0.7 | 0.7 | 13.7 | 13.1 | 10.6 | 8.5 | 0.8 | 0.9 | 0.6 |
| Republic of Karakalpakstan | - | - | - | - | - | - | - | - | - | - | - | - | - | - | - | - | - | - | - | - | - | - | - | 0.1 | 0.0 | |
| regions: | ||||||||||||||||||||||||||
| Andijan | - | - | - | - | - | - | - | - | - | - | - | - | - | - | - | - | - | - | - | - | - | - | - | 0.0 | 0.1 | |
| Bukhara | - | - | - | - | - | - | - | - | - | - | - | - | - | - | - | - | - | - | - | - | - | - | - | 0.2 | 0.5 | |
| Jizzakh | - | - | - | - | - | - | - | - | - | - | - | - | - | - | - | - | - | - | - | - | - | - | - | 0.3 | 0.2 | |
| Kashkadarya | - | - | - | - | - | - | - | - | - | - | - | - | - | - | - | - | - | - | - | - | - | - | - | 0.1 | 0.1 | |
| Navoi | - | - | - | - | - | - | - | - | - | - | - | - | - | - | - | - | - | - | - | - | - | - | - | 1.1 | 0.6 | |
| Namangan | - | - | - | - | - | - | - | - | - | - | - | - | - | - | - | - | - | - | - | - | - | - | - | 0.3 | 0.2 | |
| Samarkand | - | - | - | - | - | - | - | - | - | - | - | - | - | - | - | - | - | - | - | - | - | - | - | 0.3 | 0.5 | |
| Surkhandarya | - | - | - | - | - | - | - | - | - | - | - | - | - | - | - | - | - | - | - | - | - | - | - | 0.0 | 0.1 | |
| Syrdarya | - | - | - | - | - | - | - | - | - | - | - | - | - | - | - | - | - | - | - | - | - | - | - | 0.6 | 0.8 | |
| Tashkent | - | - | - | - | - | - | - | - | - | - | - | - | - | - | - | - | - | - | - | - | - | - | - | 6.8 | 4.0 | |
| Fergana | - | - | - | - | - | - | - | - | - | - | - | - | - | - | - | - | - | - | - | - | - | - | - | 0.2 | 0.2 | |
| Khorezm | - | - | - | - | - | - | - | - | - | - | - | - | - | - | - | - | - | - | - | - | - | - | - | 0.2 | 0.2 | |
| Tashkent city | - | - | - | - | - | - | - | - | - | - | - | - | - | - | - | - | - | - | - | - | - | - | - | 1.7 | 0.8 | |
| 3 | Indicator 12.4.2.2. The share of neutralized production waste of 1-3 hazard classes in total volume of generated production waste of 1-3 hazard classes. | - | - | - | - | - | - | - | - | - | - | - | - | - | - | 11.2 | 8.1 | 11.6 | 9.8 | 0.12 | 0.2 | 0.2 | 0.3 | 7.6 | 2.7 | 17.0 |
| Republic of Karakalpakstan | - | - | - | - | - | - | - | - | - | - | - | - | - | - | - | - | - | - | - | - | - | - | - | 0.7 | 0.5 | |
| regions: | ||||||||||||||||||||||||||
| Andijan | - | - | - | - | - | - | - | - | - | - | - | - | - | - | - | - | - | - | - | - | - | - | - | 0.0 | 0.0 | |
| Bukhara | - | - | - | - | - | - | - | - | - | - | - | - | - | - | - | - | - | - | - | - | - | - | - | 11.7 | 4.2 | |
| Jizzakh | - | - | - | - | - | - | - | - | - | - | - | - | - | - | - | - | - | - | - | - | - | - | - | 0.1 | 0.1 | |
| Kashkadarya | - | - | - | - | - | - | - | - | - | - | - | - | - | - | - | - | - | - | - | - | - | - | - | 11.2 | 9.3 | |
| Navoi | - | - | - | - | - | - | - | - | - | - | - | - | - | - | - | - | - | - | - | - | - | - | - | 2.6 | 3.2 | |
| Namangan | - | - | - | - | - | - | - | - | - | - | - | - | - | - | - | - | - | - | - | - | - | - | - | 0.6 | 0.0 | |
| Samarkand | - | - | - | - | - | - | - | - | - | - | - | - | - | - | - | - | - | - | - | - | - | - | - | 16.2 | 27.4 | |
| Surkhandarya | - | - | - | - | - | - | - | - | - | - | - | - | - | - | - | - | - | - | - | - | - | - | - | 15.0 | 41.1 | |
| Syrdarya | - | - | - | - | - | - | - | - | - | - | - | - | - | - | - | - | - | - | - | - | - | - | - | 4.7 | 0.2 | |
| Tashkent | - | - | - | - | - | - | - | - | - | - | - | - | - | - | - | - | - | - | - | - | - | - | - | 0.4 | 0.5 | |
| Fergana | - | - | - | - | - | - | - | - | - | - | - | - | - | - | - | - | - | - | - | - | - | - | - | 52.7 | 338.5 | |
| Khorezm | - | - | - | - | - | - | - | - | - | - | - | - | - | - | - | - | - | - | - | - | - | - | - | 0.0 | 0.0 | |
| Tashkent city | - | - | - | - | - | - | - | - | - | - | - | - | - | - | - | - | - | - | - | - | - | - | - | 0.2 | 1.2 | |
| 4 | Indicator 12.5.1. National recycling rate, tons of material recycled. | |||||||||||||||||||||||||
| a) recycling rate; | - | - | - | - | - | - | - | - | - | - | - | - | - | - | - | - | - | - | - | - | - | - | - | - | 5.2 | |
| b) tons of material recycled.. | - | - | - | - | - | - | - | - | - | - | - | - | - | - | - | - | - | 631 360 | 1 370 100 | 1 399 934 | 1 025 926 | 1 698 161 | 2 200 000 | 2 619 000 | 766 000 | |
| 5 | Indicator 12.b.1.1. Share of tourism services in export (percentage). | 1.0 | 0.7 | 0.7 | 0.7 | 0.6 | 0.4 | 0.4 | 0.6 | 0.5 | 0.8 | 2.1 | 2.3 | 4.2 | 7.8 | 7.8 | 9.5 | 10.4 | 4.4 | 7.4 | 7.5 | 1.7 | 2.5 | 8.3 | 8.60 | 12.9 |