
Progress towards achieving Goal 17 has been mixed. On the one hand, there have been some advances in areas such as development aid, remittances flows and access to technology. However, funding for development remains a major challenge, in particular in low-income countries. Many developing countries are battling record inflation, rising interest rates and looming debt burdens, competing priorities, and limited fiscal space.
On the basis of 2021 data from 130 economies, government revenue accounted for approximately 33 per cent of GDP on average. In addition, the average overall tax burden or revenue in the form of taxes was 26 per cent of GDP among advanced economies and 17 per cent of GDP among emerging market and developing economies.
Net ODA flows amounted to $206 billion (current price) in 2022, an increase of 15.3 per cent in real terms compared with 2021.
In 2022, an estimated 66 per cent of the world’s population (5.3 billion) used the Internet, compared with 40 per cent (3 billion) in 2015. Globally, 259 million more men than women used the Internet in 2022.
Uzbekistan is actively involved in the implementation of the Sustainable Development Goals. UN agencies have assisted the government in implementing country development programs since 1993. Since 1992, the total amount of financial assistance to the UN system has amounted to about 471 million US dollars. This financial support was expressed in the transfer of best practices of other countries for the development of Uzbekistan.
The Sustainable Development Goals are of particular importance for the republic, because for the first time in the history of the United Nations, in the process of a comprehensive global consultation process, a unified vision of development until 2030 was developed. This agenda was approved by 193 UN member states and, thus, represents a universal vision of the world until 2030. The idea of the SDGs is that the process of economic development should go hand in hand with improving social protection and involving vulnerable groups in the development process.
In general, the consistent implementation of the reforms carried out in Uzbekistan should contribute to the successful achievement of the goals outlined in the 2030 Agenda for Sustainable Development, as well as to the growth of well-being of the population and the solution of pressing socio-economic issues in the country.
National Tasks
Target 17.1. Strengthen internal and external resource mobilization to ensure adequate quality of socio-economic programs.
Target 17.3. Mobilize additional financial resources from external sources for the implementation of socio-economic development programs.
Target 17.4. Maintain the level of public debt at a level ensuring stability of financial and economic state of the country.
Target 17.6. Expand international cooperation in science, technology and innovation and enhance knowledge-sharing in the interests of deepening structural reforms.
Target 17.8. Fully operationalize the technology bank and science, technology and innovation capacity-building mechanisms by 2030 and enhance the use of enabling technology, in particular information and communication technology.
Target 17.13. Enhance global macroeconomic stability, including through the policy coordination and policy coherence.
Target 17.14. Form long-term mechanisms to integrate the principles of sustainable development into the decision-making process, and strategies and programs implementation and development.
Target 17.17. Encourage and promote effective public-private sectors and civil society partnerships when implementing social and economic development programs.
Target 17.18. By 2020 significantly increase the availability of high-quality, timely and reliable data disaggregated by income, gender, age, race, ethnicity, nationality, social status, geographic location and other characteristics relevant in national contexts.
Target 17.19. By 2030, build on existing initiatives to develop measurements of progress on sustainable development that complement gross domestic product, and support statistical capacity-building.
National indicators
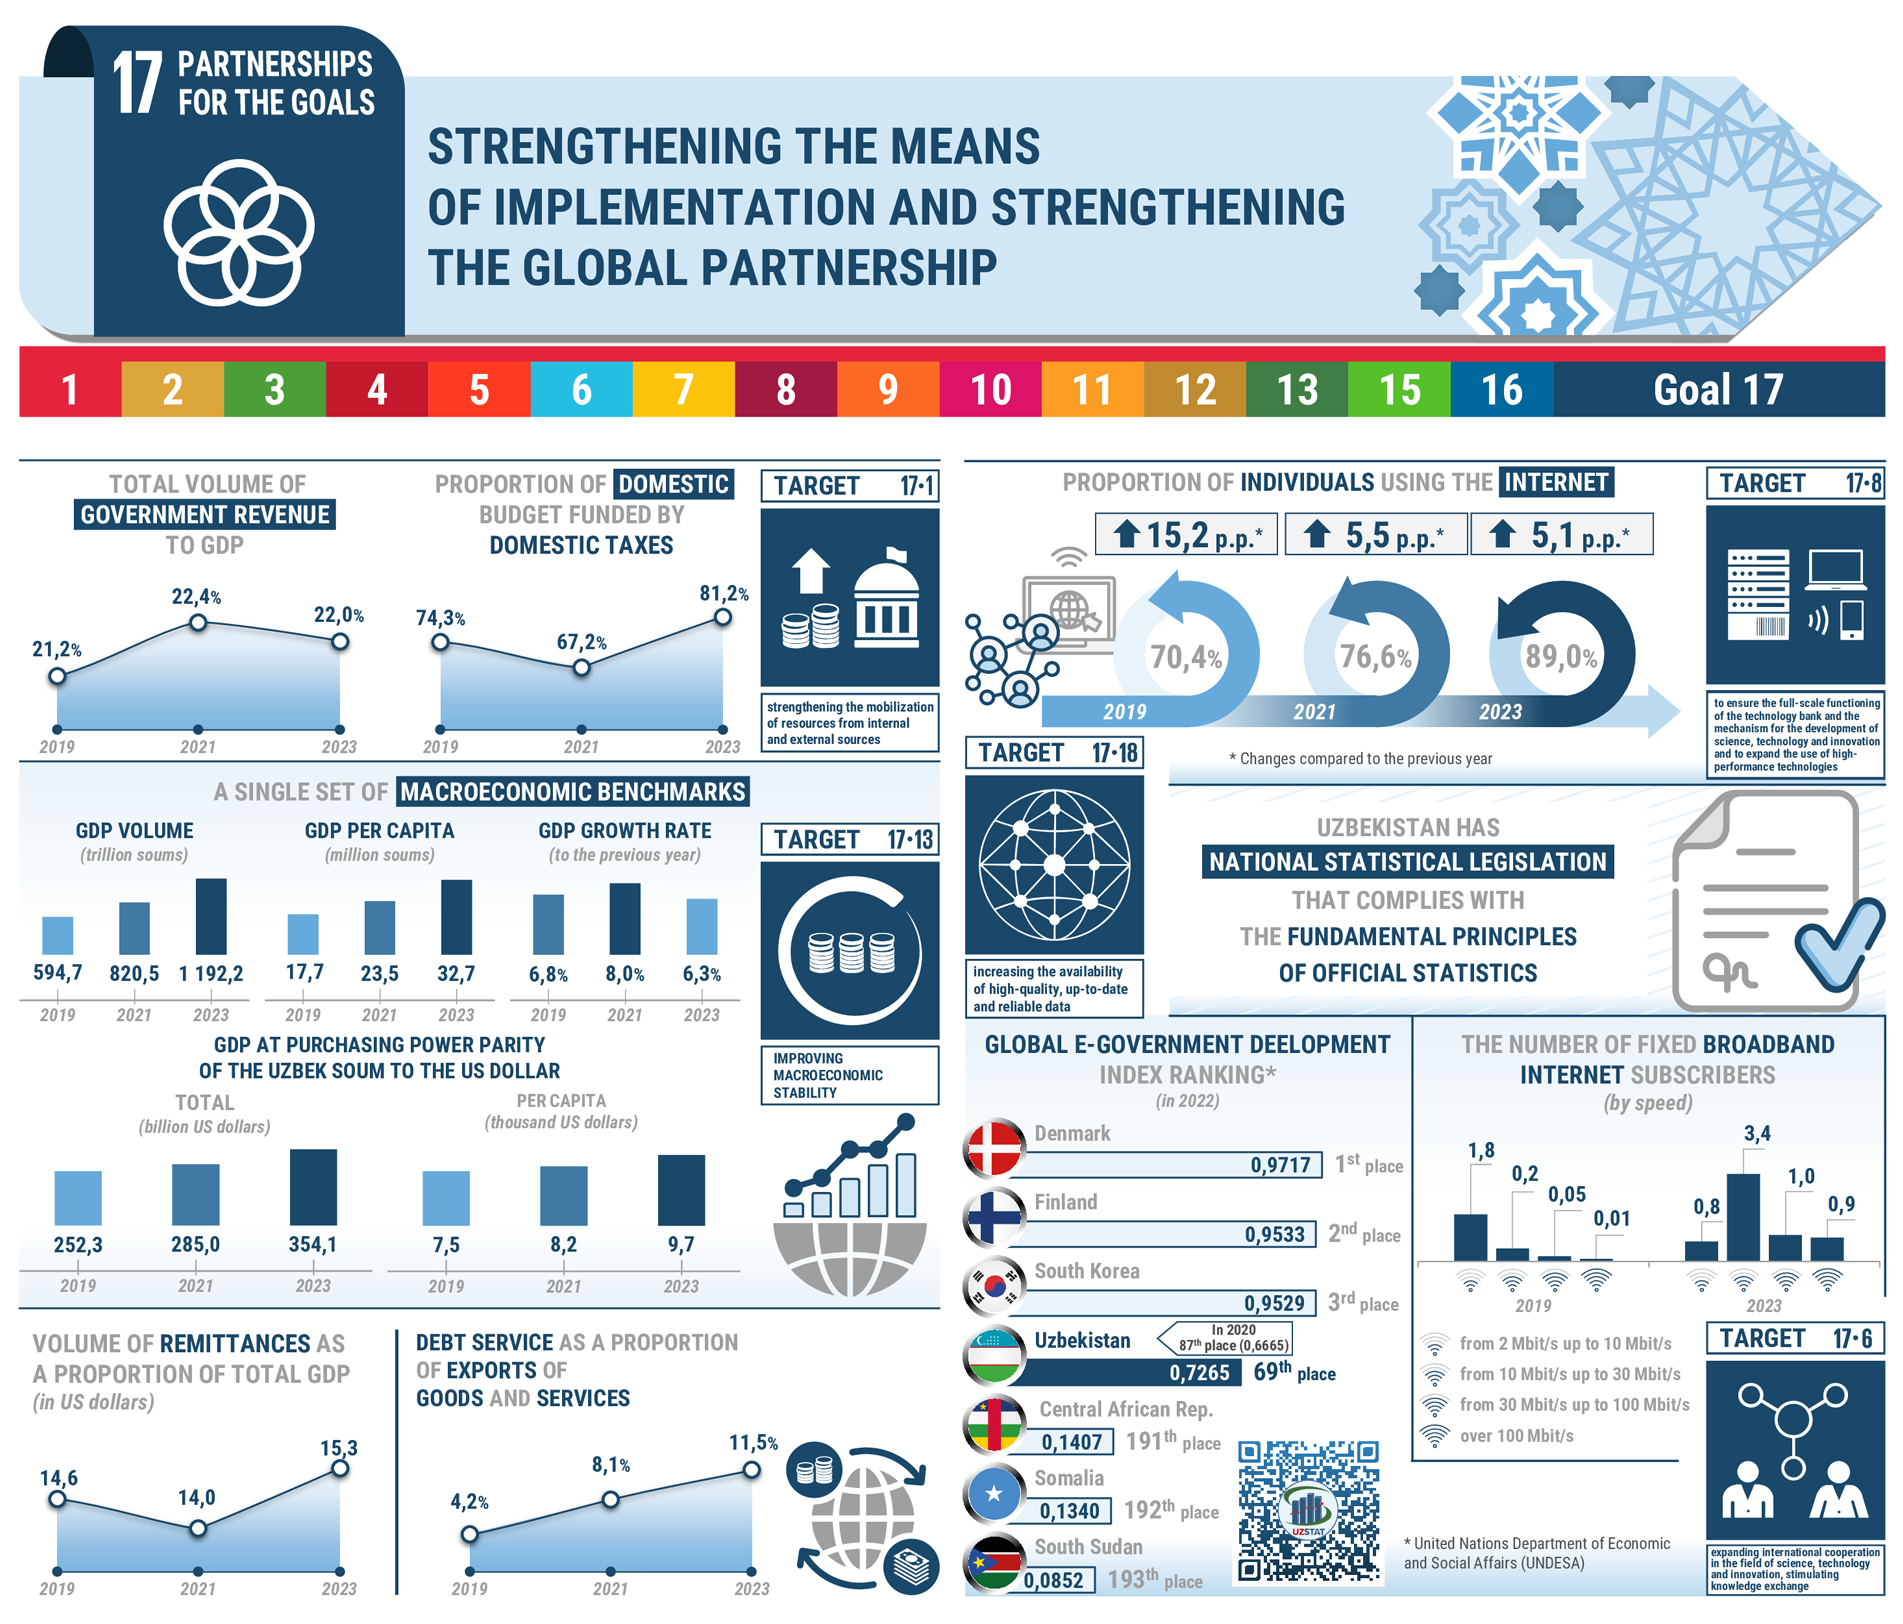
| NATIONAL INDICATORS | 2000 | 2001 | 2002 | 2003 | 2004 | 2005 | 2006 | 2007 | 2008 | 2009 | 2010 | 2011 | 2012 | 2013 | 2014 | 2015 | 2016 | 2017 | 2018 | 2019 | 2020 | 2021 | 2022 | 2023 | 2024 | |
| 1 | Indicator 17.1.1. Total government revenue as a percentage of GDP, by source. | 27.9 | 25.7 | 25.0 | 23.8 | 22.4 | 21.6 | 20.7 | 18.0 | 15.2 | 14.0 | 17.2 | 16.5 | 16.7 | 17.1 | 17.0 | 16.5 | 16.1 | 15.6 | 18.6 | 21.2 | 22.1 | 22.4 | 22.7 | 19.2 | 18.9 |
| 2 | Indicator 17.1.2. Proportion of domestic budget funded by domestic taxes. | - | - | - | - | - | - | - | 82.0 | 82.7 | 77.7 | 79.0 | 79.8 | 77.8 | 75.5 | 73.7 | 75.4 | 76.6 | 76.0 | 68.5 | 74.3 | 77.9 | 67.2 | 73.6 | 82.4 | 88.3 |
| 3 | Indicator 17.3.1. Foreign direct investment, official development assistance and South-South cooperation as a proportion of gross national income. | - | - | - | - | - | - | - | - | - | - | - | - | - | - | - | - | - | - | - | - | 10.0 | 11.1 | 11.9 | 22.4 | - |
| 4 | Indicator 17.3.2. Volume of remittances (in US dollars) as a proportion of total GDP. | - | - | - | - | - | - | - | - | - | - | - | - | - | - | - | - | 6.7 | 10.2 | 13.0 | 12.7 | 10.7 | 12.0 | 17.2 | 13.8 | 14.4 |
| 5 | Indicator 17.4.1. Debt service as a proportion of exports of goods and services. | - | - | - | - | - | - | - | - | - | - | - | - | - | 2.1 | 2.5 | 3.1 | 3.6 | 3.7 | 4.0 | 4.2 | 7.0 | 8.1 | 8.4 | 15.3 | 15.0 |
| 6 | Indicator 17.6.1. The number of fixed broadband Internet subscribers by speed: | - | - | - | - | - | - | - | - | - | 0.5 | 0.7 | 0.8 | 0.9 | 0.9 | 1.2 | 1.5 | 1.6 | 1.5 | 1.9 | 2.2 | 3.2 | 4.2 | 5.2 | 6.10 | 7.89 |
| a) from 256 kbit/sec. up to 2 Mbit/sec.; | - | - | - | - | - | - | - | - | - | - | - | - | - | - | - | - | - | - | - | 0.1 | 0.1 | 0.04 | 0.2 | 0.02 | 0.01 | |
| b) from 2 Mbit/sec. up to 10 Mbit/sec.; | - | - | - | - | - | - | - | - | - | - | - | - | - | - | - | - | - | - | - | 1.8 | 2.4 | 1.7 | 1.2 | 0.8 | 0.6 | |
| c) from 10 Mbit/sec. up to 30 Mbit/sec.; | - | - | - | - | - | - | - | - | - | - | - | - | - | - | - | - | - | - | - | 0.2 | 0.6 | 2.1 | 2.6 | 3.4 | 1.2 | |
| d) from 30 Mbit/sec. up to 100 Mbit/sec.; | - | - | - | - | - | - | - | - | - | - | - | - | - | - | - | - | - | - | - | 0.05 | 0.1 | 0.3 | 0.8 | 1.0 | 4.3 | |
| e) over 100 Mbit/sec. | - | - | - | - | - | - | - | - | - | - | - | - | - | - | - | - | - | - | - | 0.01 | 0.01 | 0.06 | 0.3 | 0.9 | 1.8 | |
| 7 | Indicator 17.8.1. Proportion of individuals using the Internet. | - | - | - | - | - | - | - | - | - | - | - | - | - | - | - | - | - | 48.7 | 55.2 | 70.4 | 71.1 | 76.6 | 83.9 | 89.0 | 93.3 |
| Republic of Karakalpakstan | - | - | - | - | - | - | - | - | - | - | - | - | - | - | - | - | - | - | - | - | - | - | - | 94.6 | 96.1 | |
| regions: | ||||||||||||||||||||||||||
| Andijan | - | - | - | - | - | - | - | - | - | - | - | - | - | - | - | - | - | - | - | - | - | - | - | 91.5 | 94.1 | |
| Bukhara | - | - | - | - | - | - | - | - | - | - | - | - | - | - | - | - | - | - | - | - | - | - | - | 94.9 | 96.5 | |
| Jizzakh | - | - | - | - | - | - | - | - | - | - | - | - | - | - | - | - | - | - | - | - | - | - | - | 91.6 | 93.9 | |
| Kashkadarya | - | - | - | - | - | - | - | - | - | - | - | - | - | - | - | - | - | - | - | - | - | - | - | 85.1 | 88.5 | |
| Navoi | - | - | - | - | - | - | - | - | - | - | - | - | - | - | - | - | - | - | - | - | - | - | - | 91.6 | 96.0 | |
| Namangan | - | - | - | - | - | - | - | - | - | - | - | - | - | - | - | - | - | - | - | - | - | - | - | 96.1 | 96.8 | |
| Samarkand | - | - | - | - | - | - | - | - | - | - | - | - | - | - | - | - | - | - | - | - | - | - | - | 94.8 | 97.9 | |
| Surkhandarya | - | - | - | - | - | - | - | - | - | - | - | - | - | - | - | - | - | - | - | - | - | - | - | 73.8 | 87.9 | |
| Syrdarya | - | - | - | - | - | - | - | - | - | - | - | - | - | - | - | - | - | - | - | - | - | - | - | 71.3 | 87.2 | |
| Tashkent | - | - | - | - | - | - | - | - | - | - | - | - | - | - | - | - | - | - | - | - | - | - | - | 83.3 | 86.8 | |
| Fergana | - | - | - | - | - | - | - | - | - | - | - | - | - | - | - | - | - | - | - | - | - | - | - | 98.1 | 97.2 | |
| Khorezm | - | - | - | - | - | - | - | - | - | - | - | - | - | - | - | - | - | - | - | - | - | - | - | 86.9 | 91.5 | |
| Tashkent city | - | - | - | - | - | - | - | - | - | - | - | - | - | - | - | - | - | - | - | - | - | - | - | 93.6 | 97.5 | |
| 8 | Indicator 17.13.1. A single set of macroeconomic benchmarks: 1) | |||||||||||||||||||||||||
| a) GDP, in billions of soums; | 3 255.6 | 4 925.3 | 7 450.2 | 9 844.0 | 12 261.0 | 15 923.4 | 21 124.9 | 28 190.0 | 38 969.8 | 49 375.6 | 88 102.4 | 115 627.8 | 142 333.0 | 173 201.5 | 210 998.3 | 250 544.6 | 290 213.4 | 369 612.8 | 494 814.8 | 620 083.2 | 705 076.5 | 861 170.8 | 1 041 877.9 | 1 261 806.0 | 1 535 431.7 | |
| Republic of Karakalpakstan | - | - | - | - | - | - | - | - | - | - | 2 604.2 | 3 385.3 | 4 236.2 | 5 519.4 | 6 887.2 | 8 339.9 | 10 524.5 | 13 755.6 | 19 372.3 | 23 896.7 | 26 136.6 | 30 697.7 | 36 667.6 | 40 805.2 | 46 299.8 | |
| regions: | ||||||||||||||||||||||||||
| Andijan | - | - | - | - | - | - | - | - | - | - | 5 058.8 | 6 892.3 | 8 487.3 | 11 159.9 | 13 331.4 | 15 705.4 | 18 376.6 | 22 904.2 | 31 623.2 | 39 663.7 | 44 097.9 | 50 817.3 | 65 233.4 | 80 337.5 | 93 026.3 | |
| Bukhara | - | - | - | - | - | - | - | - | - | - | 5 131.6 | 6 777.3 | 7 949.5 | 9 481.3 | 11 729.4 | 14 223.4 | 16 594.9 | 19 970.6 | 25 773.6 | 33 081.4 | 36 621.6 | 44 628.2 | 53 714.9 | 63 693.4 | 73 434.1 | |
| Jizzakh | - | - | - | - | - | - | - | - | - | - | 2 439.9 | 3 350.4 | 4 130.4 | 5 040.6 | 6 281.3 | 7 458.5 | 8 719.4 | 10 893.2 | 14 709.9 | 18 553.0 | 20 871.6 | 26 338.6 | 31 274.3 | 38 570.3 | 43 545.9 | |
| Kashkadarya | - | - | - | - | - | - | - | - | - | - | 7 627.3 | 9 806.9 | 12 040.4 | 14 126.3 | 16 918.3 | 20 220.7 | 23 743.4 | 25 848.1 | 31 690.4 | 39 011.2 | 42 298.6 | 51 181.1 | 59 822.3 | 71 425.0 | 83 950.0 | |
| Navoi | - | - | - | - | - | - | - | - | - | - | 4 580.7 | 5 613.9 | 6 927.8 | 8 241.3 | 9 844.8 | 11 191.5 | 12 739.3 | 18 456.2 | 27 190.4 | 42 400.1 | 60 326.4 | 69 162.2 | 78 668.2 | 93 651.5 | 130 439.5 | |
| Namangan | - | - | - | - | - | - | - | - | - | - | 3 968.5 | 5 469.3 | 6 836.0 | 8 431.8 | 10 367.1 | 12 567.1 | 15 062.1 | 18 609.5 | 22 956.4 | 29 384.4 | 34 169.1 | 41 993.6 | 50 668.2 | 61 074.9 | 71 869.1 | |
| Samarkand | - | - | - | - | - | - | - | - | - | - | 7 143.4 | 9 005.3 | 10 953.9 | 13 691.5 | 17 119.4 | 20 481.8 | 25 429.8 | 30 938.3 | 37 852.1 | 45 037.4 | 49 635.9 | 61 599.3 | 71 714.9 | 86 313.3 | 103 882.7 | |
| Surkhandarya | - | - | - | - | - | - | - | - | - | - | 3 802.2 | 5 779.1 | 7 134.7 | 8 388.8 | 10 412.8 | 12 577.0 | 13 878.7 | 17 310.5 | 21 616.8 | 26 239.2 | 28 533.6 | 34 694.1 | 40 789.7 | 49 208.9 | 56 553.9 | |
| Syrdarya | - | - | - | - | - | - | - | - | - | - | 1 856.9 | 2 607.5 | 3 204.1 | 3 798.9 | 4 579.1 | 5 628.1 | 6 802.1 | 8 115.8 | 9 992.6 | 13 905.7 | 14 676.8 | 17 318.2 | 20 746.6 | 24 873.0 | 28 655.5 | |
| Tashkent | - | - | - | - | - | - | - | - | - | - | 8 347.3 | 11 169.1 | 13 960.8 | 17 104.7 | 20 824.7 | 24 435.7 | 26 724.2 | 33 619.1 | 45 784.6 | 62 375.4 | 74 685.6 | 94 668.7 | 105 520.0 | 124 087.1 | 151 251.8 | |
| Fergana | - | - | - | - | - | - | - | - | - | - | 6 209.9 | 8 326.1 | 10 418.0 | 12 743.8 | 15 810.6 | 18 988.4 | 21 206.6 | 25 148.1 | 33 037.2 | 40 207.5 | 45 653.1 | 58 406.3 | 68 370.1 | 81 573.3 | 93 605.7 | |
| Khorezm | - | - | - | - | - | - | - | - | - | - | 3 197.0 | 4 309.4 | 5 324.1 | 6 558.5 | 8 178.3 | 9 971.0 | 11 568.7 | 13 548.2 | 18 184.2 | 22 262.8 | 24 668.3 | 30 907.3 | 38 927.4 | 45 358.6 | 53 640.0 | |
| Tashkent city | - | - | - | - | - | - | - | - | - | - | 11 863.8 | 15 346.0 | 19 021.5 | 23 060.0 | 28 294.7 | 34 080.0 | 42 307.8 | 57 710.0 | 75 074.2 | 99 397.2 | 111 465.3 | 144 477.1 | 178 973.3 | 222 926.1 | 302 878.5 | |
| b) GDP growth rate, as a percentage of the previous year; | 103.8 | 104.2 | 104.0 | 104.2 | 107.4 | 107.0 | 107.5 | 109.5 | 109.0 | 108.1 | 107.7 | 108.1 | 107.4 | 107.9 | 107.7 | 107.9 | 106.7 | 104.7 | 105.7 | 106.8 | 101.6 | 108.2 | 106.1 | 106.3 | 106.7 | |
| Republic of Karakalpakstan | - | - | - | - | - | - | - | - | - | - | 113.8 | 110.9 | 110.7 | 111.6 | 110.6 | 111.5 | 112.3 | 107.2 | 106.3 | 106.4 | 101.1 | 106.4 | 104.2 | 102.1 | 104.2 | |
| regions: | ||||||||||||||||||||||||||
| Andijan | - | - | - | - | - | - | - | - | - | - | 110.4 | 110.8 | 108.7 | 108.9 | 108.4 | 103.9 | 101.9 | 104.1 | 110.5 | 106.8 | 102.2 | 105.5 | 109.0 | 105.1 | 106.6 | |
| Bukhara | - | - | - | - | - | - | - | - | - | - | 110.3 | 112.1 | 108.0 | 109.2 | 109.4 | 109.7 | 106.6 | 101.5 | 106.2 | 107.5 | 101.7 | 106.3 | 105.7 | 104.7 | 105.6 | |
| Jizzakh | - | - | - | - | - | - | - | - | - | - | 110.2 | 111.4 | 107.8 | 110.1 | 108.3 | 108.6 | 108.9 | 104.2 | 106.1 | 107.9 | 103.7 | 108.2 | 104.9 | 106.3 | 104.6 | |
| Kashkadarya | - | - | - | - | - | - | - | - | - | - | 103.9 | 107.1 | 105.2 | 106.5 | 108.4 | 107.3 | 106.0 | 103.6 | 101.7 | 102.0 | 102.0 | 107.7 | 106.7 | 105.5 | 105.9 | |
| Navoi | - | - | - | - | - | - | - | - | - | - | 104.5 | 107.4 | 104.8 | 104.5 | 105.6 | 103.7 | 103.6 | 101.7 | 104.8 | 105.1 | 106.7 | 107.3 | 106.4 | 106.6 | 108.2 | |
| Namangan | - | - | - | - | - | - | - | - | - | - | 110.8 | 110.6 | 107.8 | 107.7 | 108.6 | 108.4 | 108.7 | 103.6 | 106.1 | 108.8 | 104.6 | 110.5 | 108.3 | 106.9 | 107.3 | |
| Samarkand | - | - | - | - | - | - | - | - | - | - | 111.8 | 111.0 | 109.3 | 107.8 | 108.7 | 108.9 | 107.4 | 102.0 | 102.1 | 106.1 | 100.2 | 109.9 | 105.9 | 106.3 | 107.4 | |
| Surkhandarya | - | - | - | - | - | - | - | - | - | - | 113.4 | 112.1 | 108.7 | 108.2 | 108.6 | 108.2 | 106.4 | 103.6 | 105.6 | 104.6 | 103.3 | 108.9 | 105.0 | 105.3 | 105.3 | |
| Syrdarya | - | - | - | - | - | - | - | - | - | - | 109.8 | 108.6 | 109.1 | 105.0 | 107.3 | 107.7 | 107.4 | 96.4 | 103.7 | 110.4 | 99.7 | 108.9 | 105.4 | 105.3 | 104.9 | |
| Tashkent | - | - | - | - | - | - | - | - | - | - | 109.5 | 106.6 | 105.1 | 106.9 | 106.5 | 106.3 | 105.2 | 101.5 | 106.4 | 108.3 | 102.5 | 110.9 | 106.0 | 106.1 | 107.6 | |
| Fergana | - | - | - | - | - | - | - | - | - | - | 108.3 | 110.9 | 106.6 | 106.9 | 108.0 | 107.7 | 105.7 | 99.1 | 107.4 | 106.1 | 105.3 | 108.3 | 105.8 | 105.7 | 105.2 | |
| Khorezm | - | - | - | - | - | - | - | - | - | - | 108.2 | 108.6 | 109.1 | 110.1 | 106.7 | 109.9 | 105.3 | 105.6 | 103.1 | 107.1 | 100.5 | 110.1 | 107.4 | 104.8 | 106.3 | |
| Tashkent city | - | - | - | - | - | - | - | - | - | - | 111.7 | 110.9 | 108.3 | 108.8 | 110.7 | 109.5 | 110.6 | 111.1 | 109.8 | 109.3 | 101.1 | 117.3 | 109.0 | 108.8 | 112.2 | |
| c) GDP per capita, thousand sums; | 132.1 | 197.3 | 294.8 | 385.0 | 474.0 | 608.5 | 797.5 | 1 049.2 | 1 427.3 | 1 778.2 | 3 084.6 | 3 941.0 | 4 780.4 | 5 727.0 | 6 860.0 | 8 004.9 | 9 112.5 | 11 411.8 | 15 014.4 | 18 465.6 | 20 596.9 | 24 664.7 | 29 226.7 | 34 653.2 | 41 306.7 | |
| Republic of Karakalpakstan | - | - | - | - | - | - | - | - | - | - | 1 572.1 | 2 006.8 | 2 488.5 | 3 201.3 | 3 936.0 | 4 693.0 | 5 833.0 | 7 517.1 | 10 437.7 | 12 683.4 | 13 676.9 | 15 855.4 | 18 686.0 | 20 511.3 | 22 963.9 | |
| regions: | ||||||||||||||||||||||||||
| Andijan | - | - | - | - | - | - | - | - | - | - | 1 937.7 | 2 559.1 | 3 102.9 | 4 013.1 | 4 708.4 | 5 445.9 | 6 258.0 | 7 667.7 | 10 404.8 | 12 805.9 | 13 964.3 | 15 777.9 | 19 839.2 | 23 920.7 | 27 139.7 | |
| Bukhara | - | - | - | - | - | - | - | - | - | - | 3 113.4 | 3 997.0 | 4 625.8 | 5 439.3 | 6 623.4 | 7 900.6 | 9 071.2 | 10 754.8 | 13 709.3 | 17 325.6 | 18 921.0 | 22 746.3 | 26 947.7 | 31 424.0 | 35 638.4 | |
| Jizzakh | - | - | - | - | - | - | - | - | - | - | 2 137.1 | 2 847.6 | 3 454.1 | 4 145.6 | 5 071.7 | 5 904.9 | 6 767.1 | 8 296.4 | 10 988.2 | 13 570.1 | 14 947.8 | 18 457.3 | 21 428.1 | 25 860.1 | 28 602.0 | |
| Kashkadarya | - | - | - | - | - | - | - | - | - | - | 2 857.2 | 3 565.6 | 4 293.2 | 4 933.6 | 5 779.9 | 6 757.6 | 7 766.4 | 8 288.4 | 9 963.3 | 12 015.7 | 12 787.2 | 15 178.7 | 17 363.5 | 20 282.6 | 23 319.6 | |
| Navoi | - | - | - | - | - | - | - | - | - | - | 5 312.2 | 6 400.5 | 7 829.7 | 9 210.3 | 10 851.9 | 12 156.8 | 13 620.6 | 19 419.4 | 27 993.8 | 42 902.1 | 60 002.4 | 67 561.0 | 75 302.2 | 87 902.7 | 120 222.2 | |
| Namangan | - | - | - | - | - | - | - | - | - | - | 1 711.3 | 2 278.8 | 2 802.0 | 3 398.0 | 4 099.0 | 4 873.2 | 5 731.6 | 6 954.2 | 8 420.6 | 10 562.7 | 12 035.2 | 14 484.6 | 17 092.8 | 20 144.8 | 23 191.8 | |
| Samarkand | - | - | - | - | - | - | - | - | - | - | 2 235.9 | 2 730.1 | 3 266.3 | 4 011.2 | 4 919.1 | 5 770.5 | 7 029.1 | 8 393.7 | 10 068.4 | 11 734.3 | 12 686.5 | 15 440.4 | 17 599.6 | 20 731.4 | 24 425.8 | |
| Surkhandarya | - | - | - | - | - | - | - | - | - | - | 1 789.3 | 2 630.5 | 3 185.6 | 3 672.0 | 4 462.7 | 5 273.6 | 5 695.0 | 6 956.8 | 8 503.5 | 10 094.0 | 10 747.1 | 12 792.8 | 14 700.1 | 17 316.1 | 19 425.6 | |
| Syrdarya | - | - | - | - | - | - | - | - | - | - | 2 576.1 | 3 555.9 | 4 300.8 | 5 017.6 | 5 943.8 | 7 180.5 | 8 536.8 | 10 025.7 | 12 143.2 | 16 591.9 | 17 194.0 | 19 910.5 | 23 373.9 | 27 474.9 | 31 065.1 | |
| Tashkent | - | - | - | - | - | - | - | - | - | - | 3 191.8 | 4 202.6 | 5 202.7 | 6 309.9 | 7 594.4 | 8 801.9 | 9 504.6 | 11 816.1 | 15 898.0 | 21 360.0 | 25 317.1 | 32 476.4 | 35 569.3 | 41 053.1 | 49 105.4 | |
| Fergana | - | - | - | - | - | - | - | - | - | - | 1 970.2 | 2 557.9 | 3 152.0 | 3 794.9 | 4 628.8 | 5 464.1 | 5 999.1 | 7 000.2 | 9 046.8 | 10 815.2 | 12 058.4 | 15 138.2 | 17 369.1 | 20 297.4 | 22 813.5 | |
| Khorezm | - | - | - | - | - | - | - | - | - | - | 2 021.8 | 2 668.2 | 3 243.4 | 3 929.6 | 4 811.3 | 5 759.6 | 6 566.4 | 7 565.5 | 9 989.7 | 12 026.8 | 13 122.2 | 16 192.9 | 20 054.3 | 22 945.5 | 26 633.7 | |
| Tashkent city | - | - | - | - | - | - | - | - | - | - | 5 236.9 | 6 663.8 | 8 181.0 | 9 825.7 | 11 978.6 | 14 306.1 | 17 564.6 | 23 608.1 | 30 181.8 | 39 120.4 | 42 189.7 | 51 211.2 | 61 515.6 | 74 343.4 | 98 440.5 | |
| d) GDP at purchasing power parity of the Uzbek soum to the US dollar: 3) | ||||||||||||||||||||||||||
| total, billion US dollars; | 65.6 | 69.8 | 73.8 | 78.3 | 86.4 | 95.3 | 105.5 | 118.6 | 131.8 | 143.5 | 156.3 | 171.5 | 180.5 | 190.6 | 199.8 | 209.1 | 216.5 | 248.8 | 263.2 | 281.7 | 283.9 | 316.7 | 359.6 | 396.0 | 434.9 | |
| per capita, US dollars. | 2 662 | 2 798 | 2 919 | 3 063 | 3 341 | 3 642 | 3 983 | 4 414 | 4 828 | 5 169 | 5 470.8 | 5 844.8 | 6 062.0 | 6 302.6 | 6 494.9 | 6 680.2 | 6 796.9 | 7 680.6 | 7 985.1 | 8 387.4 | 8 292.3 | 9 069.8 | 10 087.8 | 10 875.1 | 11 619.8 | |
| 9 | Indicator 17.17.1. Amount in United States dollars committed to public-private partnerships for infrastructure, million US dollars. | - | - | - | - | - | - | - | - | - | - | - | - | - | - | - | - | - | - | - | - | - | 18.5 | 17.8 | - | 15.8 |
| 10 | Indicator 17.18.1. Statistical Performance Indicators (Statistical Performance Index) for Sustainable Development Goal monitoring, index) / rank among countries. 2) | - | - | - | - | 57,8/87 | 60,0/92 | 57,8/100 | 57,8/101 | 61,1/87 | 57,8/100 | 61,1/91 | 61,1/97 | 57,8/105 | 57,8/103 | 54,4/114 | 51,1/123 | 36,7/151 | 42,6/148 | 49,5/142 | 53,2/124 | 67,5/80 | 71,1/85 | 74,1/79 | 80,3/62 | - |
| 11 | Indicator 17.18.2. Existence of national statistical legislation that complies with the Fundamental Principles of Official Statistics. | Available | Available | Available | Available | Available | Available | Available | Available | Available | Available | Available | Available | Available | Available | Available | Available | Available | Available | Available | Available | Available | Available | Available | Available | Available |
| 12 | Indicator 17.18.3. Existence of a fully funded and ongoing national statistical plan, by source of funding. | Available | Available | Available | Available | Available | Available | Available | Available | Available | Available | Available | Available | Available | Available | Available | Available | Available | Available | Available | Available | Available | Available | Available | Available | Available |
1) For the period 2010–2017, data in current prices were revised in accordance with the SNA 2008 methodology, taking into account the non-observed economy. Since 2018, annual current and conceptual revisions have been carried out
2) 2004-2015 The indicator was called “Statistical capacity indicator (statistical capacity index) for Sustainable Development Goal monitoring”. According to the World Bank
3) According to the World Bank