
Billions of people still lack access to safe water, sanitation and hygiene, despite improvements in the provision of those basic services. Water scarcity is a growing problem in many parts of the world, and conflicts and climate change are exacerbating the issue. In addition, water pollution is a significant challenge that affects both human health and the environment in many countries. Achieving universal coverage by 2030 will require a six-fold increase in current global rates of progress on drinking water, a five-fold increase for sanitation and a three-fold increase for hygiene. Boosting infrastructure investment, improving cross-sectoral coordination and addressing climate change are essential to getting Goal 6 back on track.
Despite the progress made, 2.2 billion people still lacked safely managed drinking water services, 3.5 billion lacked safely managed sanitation services, and 2.0 billion lacked basic hygiene services in 2022.
According to data from 140 countries, 58 percent of household wastewater was safely treated in 2022.
Uzbekistan is a state located in a semi-arid region, which receives 80% of the required water resources from neighboring countries located in the upper reaches of the rivers. Located downstream, Uzbekistan uses water from its two main transboundary rivers (Syr Darya and Amu Darya) for the needs of its agriculture. The country is very dependent on irrigated agriculture, which is about 17% of GDP. Agriculture provides jobs, directly and indirectly, for about 40% of the population of Uzbekistan and is almost completely dependent on irrigation of all major crops. The total annual water consumption in Uzbekistan averages 51 km3, of which about 46.8 km3 or 90% is used in agriculture.
An assessment of future water demand shows that today the need for water for irrigation and other needs is not fully satisfied, and in the face of climate change, the shortage of water resources in Central Asia will increase significantly. Even with an increase in the drainage basins of the Amu Darya and Syr Darya rivers, the volume of water will not satisfy the growing demand. The deficit in this case will be 8%, and with the same stock, 15%. But if the flow decreases, the deficit will reach 33%.
According to official figures, approximately 88% of the urban and 79% of the rural population have access to tap water. However, only 17% of users have continuous access, and more than 65 percent of users receive water for less than six hours a day. The situation is especially difficult in rural areas, where regular breakdowns of equipment are often found, or there is no centralized water supply system at all.
Compared to access to central drinking water services, access to central city sewage services is much more limited. The effective coverage rate is estimated at 17% and is limited to approximately 70 cities. Built in the 70s and 80s of the last century, it is largely outdated and in poor condition. Wastewater treatment capacity has also dropped dramatically, which often makes it difficult to remove contaminants.
National Tasks
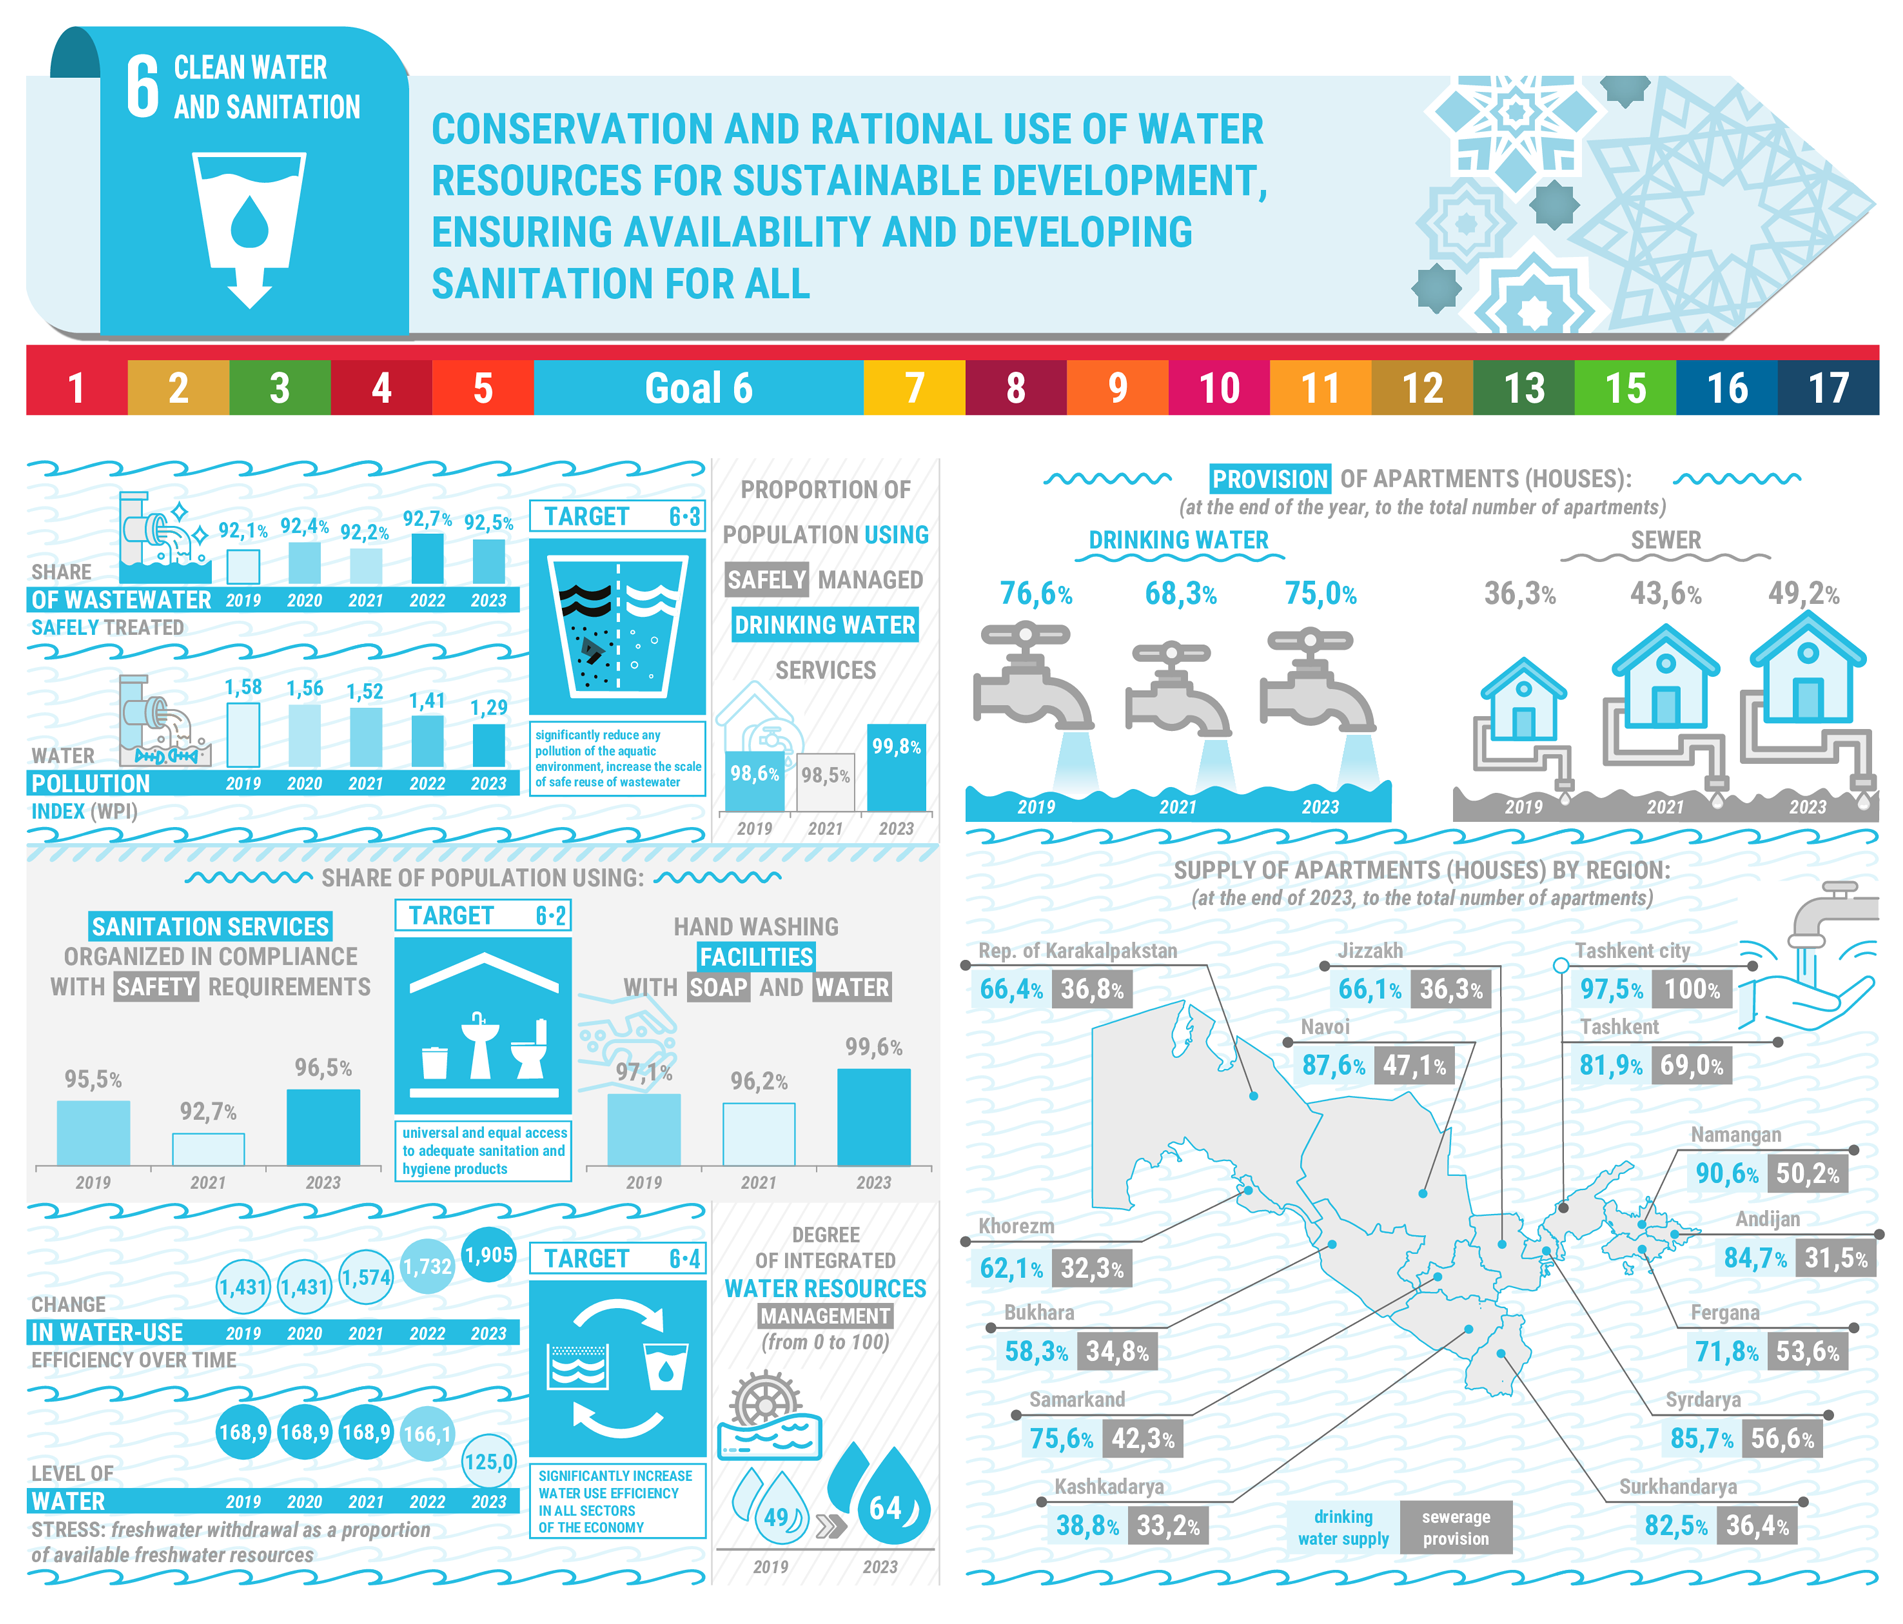
Target 6.1. By 2030, ensure universal and equitable access to clean drinking water for all.
Target 6.2. By 2030, ensure universal and equitable access to adequate sanitation and hygiene for all, paying special attention to the needs of those in vulnerable situations.
Target 6.3. By 2030, significantly reduce any pollution of the aquatic environment, including as a result of land activities and increase the scale of safe reuse of wastewater.
Target 6.4. By 2030, substantially increase water-use efficiency across all sectors of economy.
Target 6.5. By 2030, ensure integrated water resources management at all levels, including transboundary cooperation where appropriate.
Target 6.6. By 2030, protect and restore water-related ecosystems, including mountains, forests, wetlands, rivers, aquifers and lakes.
Target 6.b. Support and strengthen the participation of citizens self-government bodies in improving water and sanitation management.
National indicators
| NATIONAL INDICATORS | 2000 | 2001 | 2002 | 2003 | 2004 | 2005 | 2006 | 2007 | 2008 | 2009 | 2010 | 2011 | 2012 | 2013 | 2014 | 2015 | 2016 | 2017 | 2018 | 2019 | 2020 | 2021 | 2022 | 2023 | 2024 | |
| 1 | Indicator 6.1.1. Proportion of population using safely managed drinking water services. | - | - | - | - | - | - | - | - | - | - | 92.9 | 96.4 | 97.5 | 97.5 | 96.4 | 98.2 | 98 | 98.2 | 97.8 | 98.6 | 98.7 | 98.5 | 99.2 | 99.8 | 99.9 |
| 2 | Indicator 6.2.1. Proportion of population using a) sanitation services organized in compliance with safety requirements, b) hand washing facilities with soap and water. | |||||||||||||||||||||||||
| a) using sanitation services organized in compliance with safety requirements; | - | - | - | - | - | - | - | - | - | - | - | - | - | - | - | - | - | - | 97.6 | 95.5 | 95.9 | 92.7 | 93.1 | 96.5 | 99.4 | |
| Republic of Karakalpakstan | - | - | - | - | - | - | - | - | - | - | - | - | - | - | - | - | - | - | - | - | - | - | - | 99.8 | 99.8 | |
| regions: | ||||||||||||||||||||||||||
| Andijan | - | - | - | - | - | - | - | - | - | - | - | - | - | - | - | - | - | - | - | - | - | - | - | 74.5 | 96.3 | |
| Bukhara | - | - | - | - | - | - | - | - | - | - | - | - | - | - | - | - | - | - | - | - | - | - | - | 99.8 | 99.9 | |
| Jizzakh | - | - | - | - | - | - | - | - | - | - | - | - | - | - | - | - | - | - | - | - | - | - | - | 100.0 | 100.0 | |
| Kashkadarya | - | - | - | - | - | - | - | - | - | - | - | - | - | - | - | - | - | - | - | - | - | - | - | 100.0 | 100.0 | |
| Navoi | - | - | - | - | - | - | - | - | - | - | - | - | - | - | - | - | - | - | - | - | - | - | - | 100.0 | 100.0 | |
| Namangan | - | - | - | - | - | - | - | - | - | - | - | - | - | - | - | - | - | - | - | - | - | - | - | 98.1 | 98.8 | |
| Samarkand | - | - | - | - | - | - | - | - | - | - | - | - | - | - | - | - | - | - | - | - | - | - | - | 99.9 | 100.0 | |
| Surkhandarya | - | - | - | - | - | - | - | - | - | - | - | - | - | - | - | - | - | - | - | - | - | - | - | 99.9 | 100.0 | |
| Syrdarya | - | - | - | - | - | - | - | - | - | - | - | - | - | - | - | - | - | - | - | - | - | - | - | 99.6 | 96.5 | |
| Tashkent | - | - | - | - | - | - | - | - | - | - | - | - | - | - | - | - | - | - | - | - | - | - | - | 100.0 | 100.0 | |
| Fergana | - | - | - | - | - | - | - | - | - | - | - | - | - | - | - | - | - | - | - | - | - | - | - | 100.0 | 100.0 | |
| Khorezm | - | - | - | - | - | - | - | - | - | - | - | - | - | - | - | - | - | - | - | - | - | - | - | 83.3 | 98.6 | |
| Tashkent city | - | - | - | - | - | - | - | - | - | - | - | - | - | - | - | - | - | - | - | - | - | - | - | 99.9 | 100.0 | |
| b) using hand washing facilities with soap and water. | - | - | - | - | - | - | - | - | - | - | - | - | - | - | - | - | - | - | 95.3 | 97.1 | 99.6 | 96.2 | 98.1 | 99.6 | 99.5 | |
| Republic of Karakalpakstan | - | - | - | - | - | - | - | - | - | - | - | - | - | - | - | - | - | - | - | - | - | - | - | 97.9 | 97.3 | |
| regions: | ||||||||||||||||||||||||||
| Andijan | - | - | - | - | - | - | - | - | - | - | - | - | - | - | - | - | - | - | - | - | - | - | - | 99.8 | 99.4 | |
| Bukhara | - | - | - | - | - | - | - | - | - | - | - | - | - | - | - | - | - | - | - | - | - | - | - | 99.6 | 99.9 | |
| Jizzakh | - | - | - | - | - | - | - | - | - | - | - | - | - | - | - | - | - | - | - | - | - | - | - | 99.7 | 99.9 | |
| Kashkadarya | - | - | - | - | - | - | - | - | - | - | - | - | - | - | - | - | - | - | - | - | - | - | - | 99.9 | 99.7 | |
| Navoi | - | - | - | - | - | - | - | - | - | - | - | - | - | - | - | - | - | - | - | - | - | - | - | 100.0 | 99.3 | |
| Namangan | - | - | - | - | - | - | - | - | - | - | - | - | - | - | - | - | - | - | - | - | - | - | - | 99.4 | 99.3 | |
| Samarkand | - | - | - | - | - | - | - | - | - | - | - | - | - | - | - | - | - | - | - | - | - | - | - | 99.6 | 99.7 | |
| Surkhandarya | - | - | - | - | - | - | - | - | - | - | - | - | - | - | - | - | - | - | - | - | - | - | - | 99.9 | 100.0 | |
| Syrdarya | - | - | - | - | - | - | - | - | - | - | - | - | - | - | - | - | - | - | - | - | - | - | - | 99.8 | 99.7 | |
| Tashkent | - | - | - | - | - | - | - | - | - | - | - | - | - | - | - | - | - | - | - | - | - | - | - | 99.3 | 99.9 | |
| Fergana | - | - | - | - | - | - | - | - | - | - | - | - | - | - | - | - | - | - | - | - | - | - | - | 99.8 | 99.8 | |
| Khorezm | - | - | - | - | - | - | - | - | - | - | - | - | - | - | - | - | - | - | - | - | - | - | - | 99.9 | 99.7 | |
| Tashkent city | - | - | - | - | - | - | - | - | - | - | - | - | - | - | - | - | - | - | - | - | - | - | - | 100.0 | 100.0 | |
| 3 | Indicator 6.3.1. Proportion of wastewater safely treated. | 75.7 | 83.0 | 85.1 | 87.1 | 86.6 | 88.1 | 88.7 | 89.8 | 81.9 | 84.4 | 86.5 | 86.6 | 93.1 | 92.5 | 92.6 | 93.5 | 94.1 | 92.2 | 93.3 | 92.1 | 92.4 | 92.2 | 92.7 | 92.50 | 93.40 |
| Republic of Karakalpakstan | - | - | - | - | - | - | - | - | - | - | - | - | - | - | - | - | - | 85.5 | 86.7 | 91.0 | 85.1 | 100.0 | 100.0 | 100.0 | 100.0 | |
| regions: | ||||||||||||||||||||||||||
| Andijan | - | - | - | - | - | - | - | - | - | - | - | - | - | - | - | - | - | 99.8 | 100.0 | 100.0 | 100.0 | 77.3 | 77.1 | 77.1 | 76.8 | |
| Bukhara | - | - | - | - | - | - | - | - | - | - | - | - | - | - | - | - | - | 98.6 | 98.7 | 98.9 | 100.0 | 100.0 | 100.0 | 100.0 | 91.6 | |
| Jizzakh | - | - | - | - | - | - | - | - | - | - | - | - | - | - | - | - | - | 19.3 | 93.1 | 98.1 | 97.2 | 96.7 | 96.3 | 94.3 | 94.3 | |
| Kashkadarya | - | - | - | - | - | - | - | - | - | - | - | - | - | - | - | - | - | 100.0 | 100.0 | 100.0 | 100.0 | 100.0 | 100.0 | 100.0 | 100.0 | |
| Navoi | - | - | - | - | - | - | - | - | - | - | - | - | - | - | - | - | - | 66.3 | 65.4 | 64.9 | 63.5 | 63.6 | 63.8 | 66.0 | 93.6 | |
| Namangan | - | - | - | - | - | - | - | - | - | - | - | - | - | - | - | - | - | 100.0 | 98.9 | 99.0 | 100.0 | 100.0 | 100.0 | 100.0 | 100.0 | |
| Samarkand | - | - | - | - | - | - | - | - | - | - | - | - | - | - | - | - | - | 99.8 | 99.7 | 100.0 | 99.6 | 99.6 | 99.6 | 100.0 | 99.6 | |
| Surkhandarya | - | - | - | - | - | - | - | - | - | - | - | - | - | - | - | - | - | 7.1 | 5.9 | 11.0 | 10.0 | 3.1 | 100.0 | 80.5 | 88.3 | |
| Syrdarya | - | - | - | - | - | - | - | - | - | - | - | - | - | - | - | - | - | 100.0 | 100.0 | 100.0 | 100.0 | 62.9 | 64.2 | 64.2 | 64.1 | |
| Tashkent | - | - | - | - | - | - | - | - | - | - | - | - | - | - | - | - | - | 77.2 | 86.6 | 85.8 | 92.5 | 90.9 | 72.1 | 72.6 | 71.6 | |
| Fergana | - | - | - | - | - | - | - | - | - | - | - | - | - | - | - | - | - | 87.2 | 87.7 | 80.0 | 80.7 | 100.0 | 100.0 | 100.0 | 99.9 | |
| Khorezm | - | - | - | - | - | - | - | - | - | - | - | - | - | - | - | - | - | 98.5 | 98.5 | 99.3 | 99.7 | 88.7 | 89.1 | 75.3 | 76.0 | |
| Tashkent city | - | - | - | - | - | - | - | - | - | - | - | - | - | - | - | - | - | 97.3 | 97.2 | 96.7 | 96.3 | 96.3 | 97.4 | 97.6 | 97.4 | |
| 4 | Indicator 6.3.2. Water pollution index (WPI). | 1.25 | 1.12 | 1.02 | 1.07 | 1.01 | 0.95 | 1.08 | 1.13 | 1.32 | 1.41 | 1.25 | 1.26 | 1.13 | 1.24 | 1.37 | 1.32 | 1.21 | 1.35 | 1.54 | 1.58 | 1.56 | 1.52 | 1.41 | 1.29 | 1.18 |
| 5 | Indicator 6.4.1. Change in water-use efficiency over time. | 0.472 | 0.472 | 0.472 | 0.698 | 0.698 | 0.698 | 0.698 | 0.698 | 1.064 | 1.064 | 1.064 | 1.064 | 1.064 | 1.338 | 1.338 | 1.338 | 1.338 | 1.338 | 1.431 | 1.431 | 1.431 | 1.574 | 1.732 | 1.91 | 2.10 |
| 6 | Indicator 6.4.2. Level of water stress: freshwater withdrawal as a proportion of available freshwater resources. | 150.8 | 150.8 | 150.8 | 141.8 | 141.8 | 141.8 | 141.8 | 141.8 | 143.9 | 143.9 | 143.9 | 143.9 | 143.9 | 168.9 | 168.9 | 168.9 | 168.9 | 168.9 | 168.9 | 168.9 | 168.9 | 168.9 | 166.1 | 125.0 | 122.0 |
| 7 | Indicator 6.5.1. Degree of integrated water resources management (from 0 to 100). | 40 | 40 | 40 | 40 | 45 | 47 | 47 | 47 | 48 | 49 | 48 | 48 | 48 | 48 | 45 | 45 | 45 | 45 | 49 | 49 | 49 | 55 | 56 | 64 | 66 |