
The pandemic and other ongoing crises are hindering progress in achieving Goal 3, exacerbating existing health inequalities and threatening progress towards universal health coverage. As a result, 25 million children missed out on important routine immunization services in 2021, and deaths from tuberculosis and malaria increased compared with the pre-pandemic period. The pandemic has also highlighted the need for stronger global health security systems to prevent and respond to future pandemics.
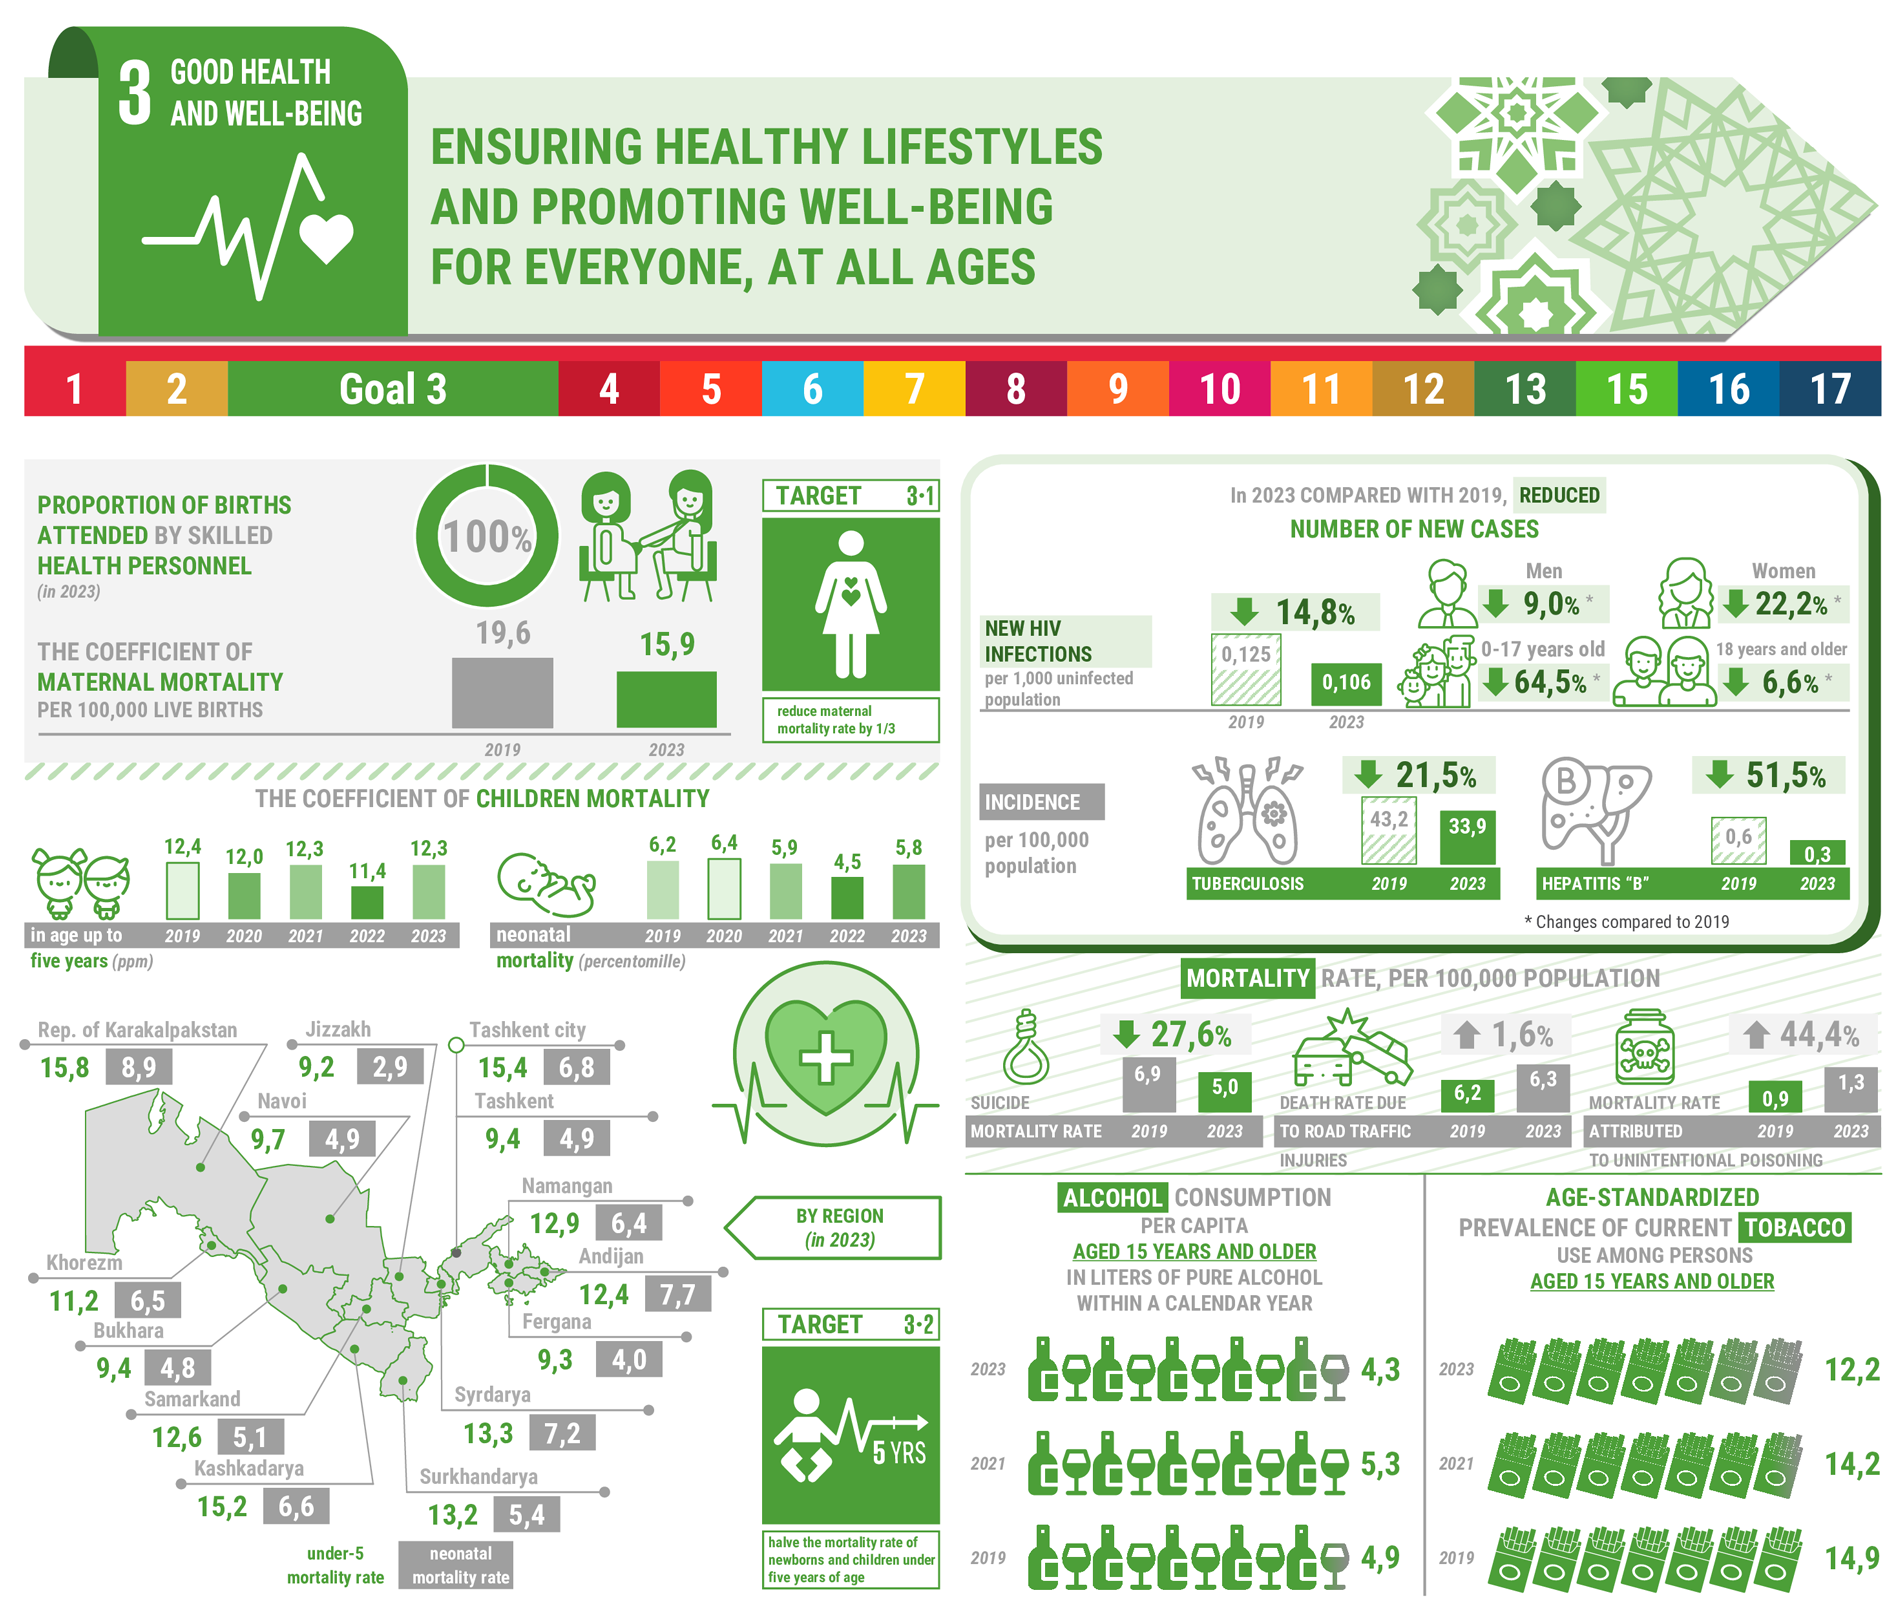
The global maternal mortality ratio decreased only from 227 maternal deaths per 100,000 live births in 2015 to 223 in 2020, still over three times higher than the target of 70 maternal deaths by 2030. This means that almost 800 women are still dying every day from preventable causes related to pregnancy and childbirth.
Between 2015 and 2021, the global under-5 mortality rate fell by 12 per cent, from 43 deaths per 1,000 live births in 2015 to 38 deaths, and the global neonatal mortality rate fell from 20 to 18 deaths. In 2021, 5 million children died before reaching their fifth birthday – down from 6.1 million in 2015.
The proportion of women of reproductive age (15–49 years) who have their need for family planning satisfied with modern contraceptive methods has been increasing slightly, from 76.5 per cent in 2015 to 77.6 per cent in 2023, and is projected to reach 78.2 per cent by 2030.
The protection of health and the creation of conditions for a healthy lifestyle of the population of the Republic of Uzbekistan is one of the important tasks facing the Government of the country. Proof of this is the relatively good development indicators in the health sector, especially when compared with countries with similar levels of development. So, as a result of the consistent implementation of the concept “Healthy mother is a healthy child” for the period 2011-2020 maternal mortality decreased from 23.1 cases to 18.5 (per 100 thousand people), mortality of children under the age of 5 years from 14.1 to 12.0 per 1,000 live births, and infant mortality from 10.4 to 9.3.
In addition, in 2020, life expectancy at birth is 73.4 years, an increase of 2.6 years compared to 2000. The observed progress is partly due to the fact that public spending on health care remains quite high and is equal to the level of expenditures typical of high-income countries.
At the same time, a number of problems remain unresolved. The health care system is not well adapted to meet the health needs of the population.
For example, the number of doctors of all specialties per 10,000 populations in 2011 was 27.7, and in 2020 this indicator decreased to 27. The number of hospital beds per 10,000 populations in 2011 was 47.3, and in 2020 it decreased to 46.6.
National Tasks
Target 3.1. By 2030, reduce by one third the maternal mortality ratio.
Target 3.2. By 2030, reduce by half the mortality of newborns and children under 5 years of age.
Target 3.3. Reduce the incidence of tuberculosis and HIV, and hepatitis, water-borne diseases and other communicable diseases.
Target 3.4. By 2030, reduce by 30 per cent premature mortality among the population from cardiovascular, oncological diseases, diabetes mellitus and chronic respiratory diseases.
Target 3.5. Strengthen the prevention and treatment of substance abuse, including narcotic drug and alcohol abuse (reducing harmful alcohol consumption by 10 per cent).
Target 3.6. By 2025, halve the number of road traffic accidents, including accidents due to traffic rules violations by pedestrians.
Target 3.7. By 2030, ensure universal access to sexual and reproductive health-care services, including for family planning and raising the marriageable age for girls under 18, and the integration of reproductive health into national strategies and programmes.
Target 3.8. Achieve universal health coverage, including financial risk protection due to high health-care services, access to quality essential health-care services and access to safe, effective, quality and affordable essential medicines and vaccines for all.
Target 3.9. Reduce the number of deaths and illnesses from water and air pollution, hazardous chemicals, including chemical production and disposal sites.
Target 3.а. If necessary, intensify implementation of the World Health Organization Convention on Tobacco Control (adopted at the 56th World Health Assembly in May 2003).
Target 3.b. Support the research and development of vaccines and medicines for the communicable and non communicable diseases, provide access to affordable essential medicines and vaccines, in accordance with the Doha Declaration on the TRIPS Agreement and Public Health, which affirms the right of developing countries to use to the full the provisions in the Agreement on Trade-Related Aspects of Intellectual Property Rights regarding flexibilities to protect public health, and, in particular, provide access to medicines for all.
Target 3.c. Successively increase health financing, personnel training and medical service provision, and ensure decent wages.
Target 3.d. Ensure implementation of the International Health Regulations (IHR is a basic WHO document, a modern edition of the rules was adopted on 25.05.2005 at the 58th session of the World Health Assembly) and preparedness for emergency public health interventions.
National indicators
| NATIONAL INDICATORS | 2000 | 2001 | 2002 | 2003 | 2004 | 2005 | 2006 | 2007 | 2008 | 2009 | 2010 | 2011 | 2012 | 2013 | 2014 | 2015 | 2016 | 2017 | 2018 | 2019 | 2020 | 2021 | 2022 | 2023 | 2024 | |
| 1 | Indicator 3.1.1. Maternal mortality ratio per 100,000 live births. | 33.1 | 34.1 | 32.0 | 32.2 | 30.2 | 29.2 | 24.8 | 23.5 | 22.4 | 30.4 | 21.0 | 23.1 | 20.2 | 20.0 | 19.1 | 18.9 | 17.4 | 21.0 | 20.2 | 19.6 | 18.5 | 14.4 | 13.9 | 15.9 | 14.8 |
| Republic of Karakalpakstan | 38.8 | 41.9 | 26.6 | 25.0 | 22.9 | 15.4 | 28.4 | 10.9 | 28.4 | 29.9 | 26.4 | 27.9 | 23.6 | 25.6 | 22.0 | 29.0 | 25.4 | 13.2 | 27.4 | 36.5 | 30.5 | 24.8 | 11.7 | 27.3 | 38.4 | |
| regions: | ||||||||||||||||||||||||||
| Andijan | 20.2 | 20.5 | 17.3 | 23.2 | 25.7 | 21.0 | 24.8 | 21.8 | 19.3 | 21.0 | 18.3 | 21.2 | 18.9 | 17.1 | 17.7 | 12.9 | 10.2 | 11.9 | 13.8 | 18.0 | 14.7 | 10.6 | 13.9 | 14.5 | 12.7 | |
| Bukhara | 49.0 | 54.4 | 37.3 | 42.2 | 23.4 | 29.9 | 19.6 | 18.4 | 38.5 | 28.7 | 23.1 | 30.4 | 20.4 | 29.9 | 10.4 | 7.6 | 7.8 | 8.1 | 19.8 | 19.4 | 9.6 | 20.8 | 17.8 | 15.0 | 23.9 | |
| Jizzakh | 29.4 | 42.5 | 29.7 | 35.2 | 24.5 | 24.8 | 21.1 | 15.7 | 10.9 | 18.6 | 27.0 | 27.8 | 19.7 | 14.6 | 16.7 | 25.1 | 28.5 | 42.0 | 26.6 | 30.2 | 13.1 | 12.1 | 12.3 | 12.2 | 7.8 | |
| Kashkadarya | 39.9 | 40.6 | 37.1 | 31.5 | 24.4 | 24.4 | 22.2 | 23.5 | 28.1 | 20.5 | 14.1 | 15.6 | 15.3 | 15.3 | 15.9 | 15.3 | 10.3 | 26.1 | 17.1 | 15.0 | 10.0 | 11.3 | 18.3 | 18.7 | 11.9 | |
| Navoi | 91.6 | 91.5 | 51.5 | 71.9 | 55.8 | 49.3 | 42.9 | 39.7 | 27.7 | 49.2 | 27.2 | 38.8 | 16.6 | 41.5 | 19.9 | 24.7 | 24.0 | 29.2 | 27.8 | 17.6 | 33.5 | 15.1 | 30.4 | 26.1 | 27.2 | |
| Namangan | 27.0 | 29.3 | 18.4 | 31.8 | 21.0 | 30.7 | 35.2 | 23.2 | 18.6 | 31.1 | 21.7 | 21.1 | 15.8 | 10.6 | 11.2 | 8.1 | 9.7 | 21.2 | 12.0 | 11.1 | 5.4 | 5.0 | 8.5 | 9.5 | 11.0 | |
| Samarkand | 26.4 | 17.9 | 21.9 | 18.0 | 20.9 | 17.4 | 14.5 | 17.4 | 12.8 | 20.0 | 16.0 | 16.2 | 17.5 | 18.2 | 19.4 | 21.4 | 18.1 | 22.2 | 19.2 | 21.9 | 9.9 | 4.5 | 6.3 | 14.0 | 9.0 | |
| Surkhandarya | 24.6 | 19.3 | 20.4 | 24.1 | 19.5 | 23.9 | 18.2 | 24.0 | 15.3 | 23.5 | 13.7 | 16.6 | 13.3 | 15.9 | 19.8 | 18.6 | 22.4 | 20.0 | 27.8 | 23.4 | 36.2 | 23.5 | 14.7 | 13.7 | 14.3 | |
| Syrdarya | 21.0 | 35.7 | 26.4 | 14.5 | 21.5 | 34.8 | 19.6 | 24.5 | 17.6 | 35.6 | 12.3 | 12.9 | 12.7 | 18.0 | 17.2 | 5.6 | 11.3 | 17.0 | 27.2 | 14.5 | 38.0 | 21.5 | 21.4 | 43.0 | 13.6 | |
| Tashkent | 27.5 | 44.2 | 59.8 | 52.7 | 43.6 | 43.2 | 31.1 | 29.8 | 30.5 | 47.8 | 32.8 | 31.7 | 28.4 | 21.8 | 27.7 | 44.3 | 35.0 | 32.9 | 27.0 | 21.8 | 28.8 | 20.6 | 19.0 | 15.0 | 17.2 | |
| Fergana | 22.5 | 25.3 | 25.8 | 28.4 | 31.6 | 31.7 | 27.0 | 25.8 | 19.3 | 30.4 | 17.0 | 25.1 | 20.9 | 21.7 | 18.3 | 12.6 | 14.0 | 21.2 | 13.5 | 19.4 | 23.6 | 17.1 | 15.8 | 14.1 | 13.6 | |
| Khorezm | 24.9 | 36.2 | 32.3 | 27.1 | 54.5 | 41.5 | 33.2 | 22.0 | 33.9 | 43.2 | 30.6 | 28.5 | 37.4 | 29.1 | 27.3 | 15.2 | 17.9 | 10.6 | 15.0 | 14.6 | 11.9 | 18.8 | 11.1 | 12.4 | 16.9 | |
| Tashkent city | 63.9 | 36.4 | 59.9 | 51.4 | 52.3 | 44.6 | 22.0 | 38.2 | 23.5 | 47.4 | 25.4 | 26.4 | 23.6 | 21.6 | 26.1 | 25.7 | 18.2 | 18.5 | 28.5 | 15.9 | 20.2 | 14.3 | 10.8 | 16.0 | 13.2 | |
| 2 | Indicator 3.1.2. Proportion of births attended by skilled health personnel. | 100.0 | 100.0 | 100.0 | 100.0 | 100.0 | 100.0 | 100.0 | 100.0 | 100.0 | 100.0 | 100.0 | 100.0 | 100.0 | 100.0 | 100.0 | 100.0 | 100.0 | 100.0 | 100.0 | 100.0 | 100.0 | 100.0 | 100.0 | 100.0 | 100.0 |
| Republic of Karakalpakstan | - | - | - | - | - | - | - | - | - | - | - | - | - | - | - | - | - | - | - | - | - | - | - | 100.0 | 100.0 | |
| regions: | ||||||||||||||||||||||||||
| Andijan | - | - | - | - | - | - | - | - | - | - | - | - | - | - | - | - | - | - | - | - | - | - | - | 100.0 | 100.0 | |
| Bukhara | - | - | - | - | - | - | - | - | - | - | - | - | - | - | - | - | - | - | - | - | - | - | - | 100.0 | 100.0 | |
| Jizzakh | - | - | - | - | - | - | - | - | - | - | - | - | - | - | - | - | - | - | - | - | - | - | - | 100.0 | 100.0 | |
| Kashkadarya | - | - | - | - | - | - | - | - | - | - | - | - | - | - | - | - | - | - | - | - | - | - | - | 100.0 | 100.0 | |
| Navoi | - | - | - | - | - | - | - | - | - | - | - | - | - | - | - | - | - | - | - | - | - | - | - | 100.0 | 100.0 | |
| Namangan | - | - | - | - | - | - | - | - | - | - | - | - | - | - | - | - | - | - | - | - | - | - | - | 100.0 | 100.0 | |
| Samarkand | - | - | - | - | - | - | - | - | - | - | - | - | - | - | - | - | - | - | - | - | - | - | - | 100.0 | 100.0 | |
| Surkhandarya | - | - | - | - | - | - | - | - | - | - | - | - | - | - | - | - | - | - | - | - | - | - | - | 100.0 | 100.0 | |
| Syrdarya | - | - | - | - | - | - | - | - | - | - | - | - | - | - | - | - | - | - | - | - | - | - | - | 100.0 | 100.0 | |
| Tashkent | - | - | - | - | - | - | - | - | - | - | - | - | - | - | - | - | - | - | - | - | - | - | - | 99.9 | 100.0 | |
| Fergana | - | - | - | - | - | - | - | - | - | - | - | - | - | - | - | - | - | - | - | - | - | - | - | 100.0 | 100.0 | |
| Khorezm | - | - | - | - | - | - | - | - | - | - | - | - | - | - | - | - | - | - | - | - | - | - | - | 100.0 | 100.0 | |
| Tashkent city | - | - | - | - | - | - | - | - | - | - | - | - | - | - | - | - | - | - | - | - | - | - | - | 100.0 | 100.0 | |
| 3 | Indicator 3.2.1. Under‑5 mortality rate. | 28.5 | 26.6 | 24.3 | 23.2 | 21.4 | 20.6 | 20.1 | 18.8 | 17.3 | 15.9 | 14.8 | 14.1 | 13.8 | 13.4 | 13.9 | 15.1 | 14.1 | 15.4 | 13.1 | 12.4 | 12.0 | 12.3 | 11.4 | 12.3 | 12.5 |
| a) girls; | - | - | - | - | - | - | - | - | - | - | - | - | - | - | - | - | - | - | - | - | 10.9 | 11.1 | 10.2 | 10.8 | 11.0 | |
| b) boys. | - | - | - | - | - | - | - | - | - | - | - | - | - | - | - | - | - | - | - | - | 13.0 | 13.4 | 12.4 | 13.6 | 14.0 | |
| Republic of Karakalpakstan | 32.4 | 32.8 | 29.7 | 24.9 | 25.9 | 23.7 | 22.9 | 19.7 | 18.7 | 18.7 | 16.5 | 15.2 | 16.3 | 15.8 | 16.1 | 15.7 | 17.1 | 20.9 | 17.3 | 14.1 | 14.4 | 13.5 | 13.8 | 15.8 | 16.8 | |
| regions: | ||||||||||||||||||||||||||
| Andijan | 23.7 | 23.2 | 20.7 | 20.1 | 19.7 | 17.6 | 19.3 | 20.9 | 17.3 | 14.8 | 12.8 | 12.9 | 15.0 | 15.0 | 15.0 | 17.6 | 17.5 | 19.9 | 17.4 | 15.4 | 15.3 | 15.0 | 12.2 | 12.4 | 15.0 | |
| Bukhara | 27.8 | 24.4 | 20.9 | 20.3 | 19.4 | 16.5 | 17.5 | 17.8 | 17.9 | 16.8 | 15.3 | 14.2 | 14.3 | 12.8 | 13.3 | 13.3 | 12.4 | 12.6 | 9.6 | 10.3 | 9.4 | 10.0 | 9.6 | 9.4 | 9.9 | |
| Jizzakh | 25.4 | 26.8 | 21.2 | 20.1 | 17.0 | 17.5 | 15.3 | 15.6 | 15.0 | 13.8 | 12.2 | 11.2 | 10.8 | 9.6 | 13.3 | 13.5 | 14.2 | 17.7 | 13.8 | 14.8 | 11.7 | 13.2 | 12.1 | 9.2 | 11.0 | |
| Kashkadarya | 29.3 | 28.0 | 25.7 | 22.4 | 20.7 | 19.7 | 18.9 | 18.2 | 17.0 | 16.2 | 13.6 | 13.7 | 12.9 | 11.6 | 11.3 | 12.5 | 11.2 | 13.2 | 12.9 | 11.2 | 11.2 | 14.4 | 15.0 | 15.2 | 15.4 | |
| Navoi | 27.7 | 25.2 | 21.0 | 22.4 | 18.1 | 16.7 | 15.2 | 13.7 | 13.2 | 12.5 | 10.1 | 10.5 | 11.5 | 10.5 | 12.0 | 12.4 | 11.8 | 12.5 | 8.9 | 9.7 | 9.1 | 9.9 | 7.4 | 9.7 | 9.8 | |
| Namangan | 29.3 | 25.7 | 23.3 | 22.3 | 19.2 | 20.6 | 17.9 | 19.1 | 17.7 | 15.8 | 15.6 | 16.2 | 15.7 | 14.1 | 14.5 | 16.0 | 13.7 | 18.6 | 15.4 | 13.7 | 14.1 | 13.5 | 9.1 | 12.9 | 11.4 | |
| Samarkand | 25.3 | 24.7 | 23.1 | 21.1 | 18.7 | 19.0 | 17.5 | 17.6 | 15.3 | 13.1 | 13.3 | 12.1 | 11.0 | 11.0 | 11.3 | 13.8 | 10.7 | 10.3 | 10.1 | 9.7 | 8.5 | 9.1 | 9.9 | 12.6 | 10.7 | |
| Surkhandarya | 34.9 | 29.7 | 26.9 | 24.9 | 19.8 | 19.3 | 17.2 | 15.7 | 14.8 | 13.6 | 13.6 | 12.8 | 13.3 | 14.2 | 15.6 | 15.3 | 14.8 | 15.3 | 14.0 | 13.8 | 12.8 | 14.4 | 14.7 | 13.2 | 11.8 | |
| Syrdarya | 25.3 | 24.9 | 23.6 | 22.3 | 22.1 | 19.7 | 20.0 | 17.9 | 17.6 | 15.1 | 13.4 | 13.3 | 14.3 | 13.6 | 13.8 | 16.1 | 17.8 | 17.2 | 15.7 | 15.0 | 13.0 | 13.2 | 17.2 | 13.3 | 13.6 | |
| Tashkent | 26.9 | 23.8 | 23.0 | 20.8 | 21.4 | 22.0 | 20.0 | 18.0 | 15.8 | 15.3 | 14.7 | 14.0 | 12.7 | 14.0 | 13.5 | 14.3 | 14.5 | 14.3 | 12.0 | 12.2 | 12.8 | 11.2 | 7.8 | 9.4 | 10.6 | |
| Fergana | 28.5 | 27.4 | 24.9 | 26.9 | 26.0 | 24.6 | 26.3 | 22.3 | 19.9 | 19.7 | 18.3 | 16.9 | 15.8 | 13.7 | 12.4 | 13.1 | 10.9 | 10.8 | 9.2 | 8.7 | 8.9 | 8.3 | 8.0 | 9.3 | 10.1 | |
| Khorezm | 37.9 | 30.1 | 28.0 | 26.2 | 24.1 | 21.8 | 22.5 | 18.5 | 20.2 | 15.8 | 15.8 | 14.6 | 14.6 | 12.7 | 17.2 | 17.7 | 18.1 | 20.2 | 15.3 | 15.6 | 14.6 | 15.9 | 11.3 | 11.2 | 12.2 | |
| Tashkent city | 23.0 | 25.1 | 25.3 | 29.1 | 25.7 | 26.5 | 27.2 | 22.5 | 20.6 | 18.7 | 19.3 | 17.6 | 15.1 | 17.2 | 19.2 | 22.0 | 20.1 | 19.7 | 14.5 | 14.4 | 14.0 | 13.0 | 13.5 | 15.4 | 16.9 | |
| including the infant mortality rate: | - | - | - | - | - | - | - | - | - | - | - | - | - | - | - | - | - | - | - | - | 9.4 | 9.2 | 8.7 | 8.5 | 9.0 | |
| a) girls; | - | - | - | - | - | - | - | - | - | - | - | - | - | - | - | - | - | - | - | - | 8.4 | 8.2 | 7.7 | 7.5 | 7.8 | |
| b) boys. | - | - | - | - | - | - | - | - | - | - | - | - | - | - | - | - | - | - | - | - | 10.2 | 10.1 | 9.6 | 9.5 | 10.0 | |
| Republic of Karakalpakstan | - | - | - | - | - | - | - | - | - | - | - | - | - | - | - | - | - | - | - | - | 12.1 | 10.6 | 10.9 | 11.5 | 12.9 | |
| regions: | ||||||||||||||||||||||||||
| Andijan | - | - | - | - | - | - | - | - | - | - | - | - | - | - | - | - | - | - | - | - | 12.8 | 12.5 | 8.8 | 9.9 | 11.8 | |
| Bukhara | - | - | - | - | - | - | - | - | - | - | - | - | - | - | - | - | - | - | - | - | 7.5 | 7.6 | 7.2 | 7.2 | 7.0 | |
| Jizzakh | - | - | - | - | - | - | - | - | - | - | - | - | - | - | - | - | - | - | - | - | 8.7 | 9.1 | 8.7 | 5.3 | 7.4 | |
| Kashkadarya | - | - | - | - | - | - | - | - | - | - | - | - | - | - | - | - | - | - | - | - | 8.0 | 9.3 | 11.2 | 10.0 | 10.6 | |
| Navoi | - | - | - | - | - | - | - | - | - | - | - | - | - | - | - | - | - | - | - | - | 7.4 | 7.1 | 4.8 | 7.1 | 6.7 | |
| Namangan | - | - | - | - | - | - | - | - | - | - | - | - | - | - | - | - | - | - | - | - | 10.6 | 10.6 | 7.7 | 9.5 | 8.0 | |
| Samarkand | - | - | - | - | - | - | - | - | - | - | - | - | - | - | - | - | - | - | - | - | 6.5 | 6.5 | 6.7 | 8.2 | 7.4 | |
| Surkhandarya | - | - | - | - | - | - | - | - | - | - | - | - | - | - | - | - | - | - | - | - | 8.6 | 9.1 | 11.5 | 7.7 | 6.6 | |
| Syrdarya | - | - | - | - | - | - | - | - | - | - | - | - | - | - | - | - | - | - | - | - | 9.8 | 10.1 | 14.6 | 10.0 | 10.7 | |
| Tashkent | - | - | - | - | - | - | - | - | - | - | - | - | - | - | - | - | - | - | - | - | 10.7 | 9.0 | 6.4 | 6.7 | 8.3 | |
| Fergana | - | - | - | - | - | - | - | - | - | - | - | - | - | - | - | - | - | - | - | - | 6.6 | 5.9 | 6.2 | 6.0 | 6.8 | |
| Khorezm | - | - | - | - | - | - | - | - | - | - | - | - | - | - | - | - | - | - | - | - | 12.6 | 12.6 | 8.4 | 8.7 | 9.5 | |
| Tashkent city | - | - | - | - | - | - | - | - | - | - | - | - | - | - | - | - | - | - | - | - | 12.2 | 11.5 | 11.1 | 11.5 | 12.9 | |
| 4 | Indicator 3.2.2. Neonatal mortality rate. | 7.7 | 7.1 | 6.9 | 7.7 | 7.3 | 6.8 | 6.7 | 6.3 | 6.6 | 6.9 | 6.6 | 6.3 | 6.1 | 6.0 | 7.1 | 7.9 | 7.1 | 7.8 | 6.9 | 6.2 | 6.4 | 5.9 | 4.5 | 5.8 | 6.3 |
| a) girls; | - | - | - | - | - | - | - | - | - | - | - | - | - | - | - | - | - | - | - | - | - | - | - | 5.0 | 5.3 | |
| b) boys. | - | - | - | - | - | - | - | - | - | - | - | - | - | - | - | - | - | - | - | - | - | - | - | 6.6 | 7.1 | |
| Republic of Karakalpakstan | 7.0 | 7.3 | 6.7 | 6.9 | 6.2 | 5.8 | 7.2 | 5.6 | 6.4 | 7.0 | 6.4 | 5.9 | 6.0 | 6.2 | 8.4 | 8.7 | 10.3 | 12.6 | 11.1 | 7.8 | 9.3 | 7.5 | 2.7 | 8.9 | 9.5 | |
| regions: | ||||||||||||||||||||||||||
| Andijan | 6.7 | 5.6 | 5.7 | 6.2 | 6.8 | 5.3 | 4.9 | 4.4 | 5.4 | 6.7 | 6.0 | 6.1 | 7.3 | 8.3 | 8.8 | 9.8 | 10.2 | 11.8 | 11.4 | 8.7 | 9.5 | 9.5 | 4.0 | 7.7 | 9.3 | |
| Bukhara | 8.6 | 8.3 | 7.1 | 7.7 | 6.5 | 5.4 | 6.8 | 7.0 | 6.7 | 7.1 | 5.9 | 6.6 | 6.3 | 5.9 | 6.0 | 6.3 | 5.6 | 6.2 | 4.3 | 4.8 | 5.1 | 4.7 | 4.6 | 4.8 | 4.8 | |
| Jizzakh | 5.7 | 5.0 | 5.0 | 6.5 | 5.3 | 4.3 | 4.4 | 5.0 | 5.4 | 5.3 | 5.7 | 5.8 | 5.4 | 4.9 | 7.0 | 6.7 | 7.7 | 9.9 | 6.5 | 8.1 | 5.5 | 5.3 | 3.2 | 2.9 | 4.9 | |
| Kashkadarya | 7.0 | 6.0 | 5.7 | 6.1 | 6.0 | 5.6 | 5.4 | 6.2 | 5.7 | 6.2 | 6.0 | 6.0 | 4.8 | 4.8 | 5.1 | 5.8 | 4.9 | 5.5 | 6.2 | 4.8 | 4.9 | 4.7 | 5.6 | 6.6 | 7.5 | |
| Navoi | 7.2 | 6.3 | 5.6 | 6.0 | 5.4 | 5.2 | 5.0 | 5.0 | 3.5 | 4.0 | 3.0 | 3.8 | 4.9 | 4.8 | 5.9 | 6.6 | 6.2 | 6.8 | 4.9 | 5.2 | 5.4 | 4.6 | 3.5 | 4.9 | 4.6 | |
| Namangan | 6.3 | 5.7 | 6.4 | 7.4 | 5.8 | 7.3 | 6.9 | 5.8 | 5.5 | 6.9 | 7.1 | 7.5 | 6.9 | 6.8 | 7.1 | 8.0 | 5.5 | 9.0 | 8.0 | 6.1 | 6.0 | 6.5 | 4.8 | 6.4 | 5.6 | |
| Samarkand | 5.2 | 5.3 | 5.3 | 6.2 | 5.2 | 5.9 | 5.8 | 6.8 | 6.8 | 6.1 | 5.8 | 6.2 | 5.4 | 5.6 | 6.7 | 8.2 | 5.9 | 5.0 | 4.8 | 4.8 | 4.5 | 3.9 | 3.3 | 5.1 | 5.4 | |
| Surkhandarya | 7.1 | 6.5 | 5.6 | 5.8 | 4.7 | 4.5 | 4.3 | 4.3 | 3.9 | 5.6 | 4.4 | 2.7 | 3.9 | 4.2 | 6.3 | 6.5 | 4.9 | 5.4 | 6.2 | 5.3 | 5.3 | 4.9 | 5.0 | 5.4 | 5.3 | |
| Syrdarya | 11.8 | 11.4 | 10.8 | 11.1 | 11.5 | 10.9 | 9.8 | 7.8 | 9.8 | 8.1 | 7.1 | 8.7 | 8.0 | 6.2 | 6.6 | 8.3 | 10.7 | 8.5 | 8.6 | 7.6 | 6.8 | 6.4 | 6.6 | 7.2 | 7.6 | |
| Tashkent | 8.4 | 8.1 | 7.6 | 7.4 | 7.7 | 6.7 | 6.2 | 5.8 | 6.2 | 6.1 | 6.0 | 6.0 | 5.6 | 5.3 | 5.6 | 6.5 | 6.5 | 6.2 | 5.9 | 6.2 | 7.3 | 5.9 | 4.4 | 4.9 | 5.4 | |
| Fergana | 8.2 | 8.6 | 7.8 | 9.7 | 10.6 | 9.4 | 8.5 | 7.5 | 7.7 | 8.8 | 8.3 | 7.4 | 7.1 | 5.5 | 5.6 | 5.4 | 4.0 | 4.1 | 3.6 | 3.5 | 4.1 | 3.7 | 3.6 | 4.0 | 4.1 | |
| Khorezm | 11.8 | 6.7 | 8.1 | 8.8 | 8.4 | 7.4 | 7.8 | 5.0 | 7.3 | 5.1 | 6.1 | 5.8 | 6.3 | 5.8 | 10.0 | 11.4 | 11.5 | 12.4 | 9.7 | 9.6 | 10.1 | 9.4 | 4.6 | 6.5 | 6.6 | |
| Tashkent city | 11.9 | 12.2 | 12.7 | 15.9 | 14.2 | 12.2 | 13.0 | 12.3 | 13.0 | 12.4 | 13.1 | 11.3 | 8.7 | 10.3 | 12.2 | 15.1 | 13.4 | 13.5 | 9.7 | 9.6 | 9.0 | 8.4 | 7.6 | 6.8 | 7.8 | |
| 5 | Indicator 3.3.1. Number of new HIV infections per 1,000 uninfected population, by sex and age: | |||||||||||||||||||||||||
| a) total; | - | - | - | - | - | - | - | - | - | - | - | 0.122 | 0.130 | 0.141 | 0.138 | 0.133 | 0.125 | 0.131 | 0.132 | 0.125 | 0.082 | 0.093 | 0.109 | 0.106 | 0.105 | |
| Republic of Karakalpakstan | - | - | - | - | - | - | - | - | - | - | - | - | - | - | - | - | - | - | - | - | - | - | 0.056 | 0.057 | 0.065 | |
| regions: | ||||||||||||||||||||||||||
| Andijan | - | - | - | - | - | - | - | - | - | - | - | - | - | - | - | - | - | - | - | - | - | - | 0.131 | 0.116 | 0.126 | |
| Bukhara | - | - | - | - | - | - | - | - | - | - | - | - | - | - | - | - | - | - | - | - | - | - | 0.079 | 0.093 | 0.087 | |
| Jizzakh | - | - | - | - | - | - | - | - | - | - | - | - | - | - | - | - | - | - | - | - | - | - | 0.062 | 0.070 | 0.078 | |
| Kashkadarya | - | - | - | - | - | - | - | - | - | - | - | - | - | - | - | - | - | - | - | - | - | - | 0.060 | 0.071 | 0.073 | |
| Navoi | - | - | - | - | - | - | - | - | - | - | - | - | - | - | - | - | - | - | - | - | - | - | 0.040 | 0.048 | 0.048 | |
| Namangan | - | - | - | - | - | - | - | - | - | - | - | - | - | - | - | - | - | - | - | - | - | - | 0.094 | 0.080 | 0.076 | |
| Samarkand | - | - | - | - | - | - | - | - | - | - | - | - | - | - | - | - | - | - | - | - | - | - | 0.112 | 0.110 | 0.103 | |
| Surkhandarya | - | - | - | - | - | - | - | - | - | - | - | - | - | - | - | - | - | - | - | - | - | - | 0.082 | 0.094 | 0.086 | |
| Syrdarya | - | - | - | - | - | - | - | - | - | - | - | - | - | - | - | - | - | - | - | - | - | - | 0.139 | 0.147 | 0.127 | |
| Tashkent | - | - | - | - | - | - | - | - | - | - | - | - | - | - | - | - | - | - | - | - | - | - | 0.212 | 0.198 | 0.194 | |
| Fergana | - | - | - | - | - | - | - | - | - | - | - | - | - | - | - | - | - | - | - | - | - | - | 0.098 | 0.098 | 0.092 | |
| Khorezm | - | - | - | - | - | - | - | - | - | - | - | - | - | - | - | - | - | - | - | - | - | - | 0.121 | 0.100 | 0.127 | |
| Tashkent city | - | - | - | - | - | - | - | - | - | - | - | - | - | - | - | - | - | - | - | - | - | - | 0.180 | 0.164 | 0.149 | |
| b) women; | - | - | - | - | - | - | - | - | - | - | - | 0.116 | 0.124 | 0.130 | 0.123 | 0.119 | 0.112 | 0.113 | 0.120 | 0.106 | 0.070 | 0.074 | 0.086 | 0.082 | 0.079 | |
| Republic of Karakalpakstan | - | - | - | - | - | - | - | - | - | - | - | - | - | - | - | - | - | - | - | - | - | - | 0.041 | 0.044 | 0.053 | |
| regions: | ||||||||||||||||||||||||||
| Andijan | - | - | - | - | - | - | - | - | - | - | - | - | - | - | - | - | - | - | - | - | - | - | 0.112 | 0.093 | 0.103 | |
| Bukhara | - | - | - | - | - | - | - | - | - | - | - | - | - | - | - | - | - | - | - | - | - | - | 0.060 | 0.078 | 0.064 | |
| Jizzakh | - | - | - | - | - | - | - | - | - | - | - | - | - | - | - | - | - | - | - | - | - | - | 0.047 | 0.056 | 0.048 | |
| Kashkadarya | - | - | - | - | - | - | - | - | - | - | - | - | - | - | - | - | - | - | - | - | - | - | 0.038 | 0.048 | 0.051 | |
| Navoi | - | - | - | - | - | - | - | - | - | - | - | - | - | - | - | - | - | - | - | - | - | - | 0.021 | 0.030 | 0.034 | |
| Namangan | - | - | - | - | - | - | - | - | - | - | - | - | - | - | - | - | - | - | - | - | - | - | 0.070 | 0.057 | 0.062 | |
| Samarkand | - | - | - | - | - | - | - | - | - | - | - | - | - | - | - | - | - | - | - | - | - | - | 0.096 | 0.089 | 0.089 | |
| Surkhandarya | - | - | - | - | - | - | - | - | - | - | - | - | - | - | - | - | - | - | - | - | - | - | 0.074 | 0.066 | 0.061 | |
| Syrdarya | - | - | - | - | - | - | - | - | - | - | - | - | - | - | - | - | - | - | - | - | - | - | 0.125 | 0.127 | 0.098 | |
| Tashkent | - | - | - | - | - | - | - | - | - | - | - | - | - | - | - | - | - | - | - | - | - | - | 0.178 | 0.177 | 0.158 | |
| Fergana | - | - | - | - | - | - | - | - | - | - | - | - | - | - | - | - | - | - | - | - | - | - | 0.069 | 0.069 | 0.066 | |
| Khorezm | - | - | - | - | - | - | - | - | - | - | - | - | - | - | - | - | - | - | - | - | - | - | 0.101 | 0.084 | 0.090 | |
| Tashkent city | - | - | - | - | - | - | - | - | - | - | - | - | - | - | - | - | - | - | - | - | - | - | 0.125 | 0.109 | 0.087 | |
| c) men; | - | - | - | - | - | - | - | - | - | - | - | 0.1 | 0.1 | 0.2 | 0.2 | 0.1 | 0.1 | 0.1 | 0.1 | 0.143 | 0.094 | 0.110 | 0.132 | 0.130 | 0.131 | |
| Republic of Karakalpakstan | - | - | - | - | - | - | - | - | - | - | - | - | - | - | - | - | - | - | - | - | - | - | 0.071 | 0.069 | 0.077 | |
| regions: | ||||||||||||||||||||||||||
| Andijan | - | - | - | - | - | - | - | - | - | - | - | - | - | - | - | - | - | - | - | - | - | - | 0.150 | 0.138 | 0.148 | |
| Bukhara | - | - | - | - | - | - | - | - | - | - | - | - | - | - | - | - | - | - | - | - | - | - | 0.098 | 0.107 | 0.109 | |
| Jizzakh | - | - | - | - | - | - | - | - | - | - | - | - | - | - | - | - | - | - | - | - | - | - | 0.078 | 0.084 | 0.107 | |
| Kashkadarya | - | - | - | - | - | - | - | - | - | - | - | - | - | - | - | - | - | - | - | - | - | - | 0.081 | 0.093 | 0.095 | |
| Navoi | - | - | - | - | - | - | - | - | - | - | - | - | - | - | - | - | - | - | - | - | - | - | 0.059 | 0.065 | 0.062 | |
| Namangan | - | - | - | - | - | - | - | - | - | - | - | - | - | - | - | - | - | - | - | - | - | - | 0.117 | 0.101 | 0.090 | |
| Samarkand | - | - | - | - | - | - | - | - | - | - | - | - | - | - | - | - | - | - | - | - | - | - | 0.127 | 0.130 | 0.118 | |
| Surkhandarya | - | - | - | - | - | - | - | - | - | - | - | - | - | - | - | - | - | - | - | - | - | - | 0.089 | 0.121 | 0.111 | |
| Syrdarya | - | - | - | - | - | - | - | - | - | - | - | - | - | - | - | - | - | - | - | - | - | - | 0.153 | 0.168 | 0.156 | |
| Tashkent | - | - | - | - | - | - | - | - | - | - | - | - | - | - | - | - | - | - | - | - | - | - | 0.245 | 0.219 | 0.230 | |
| Fergana | - | - | - | - | - | - | - | - | - | - | - | - | - | - | - | - | - | - | - | - | - | - | 0.127 | 0.126 | 0.117 | |
| Khorezm | - | - | - | - | - | - | - | - | - | - | - | - | - | - | - | - | - | - | - | - | - | - | 0.140 | 0.115 | 0.164 | |
| Tashkent city | - | - | - | - | - | - | - | - | - | - | - | - | - | - | - | - | - | - | - | - | - | - | 0.238 | 0.222 | 0.214 | |
| d) 0-17 years old; | - | - | - | - | - | - | - | - | - | - | - | 0.084 | 0.076 | 0.072 | 0.067 | 0.063 | 0.055 | 0.051 | 0.051 | 0.041 | 0.022 | 0.020 | 0.021 | 0.015 | 0.011 | |
| Republic of Karakalpakstan | - | - | - | - | - | - | - | - | - | - | - | - | - | - | - | - | - | - | - | - | - | - | 0.002 | 0.004 | 0.003 | |
| regions: | ||||||||||||||||||||||||||
| Andijan | - | - | - | - | - | - | - | - | - | - | - | - | - | - | - | - | - | - | - | - | - | - | 0.047 | 0.031 | 0.018 | |
| Bukhara | - | - | - | - | - | - | - | - | - | - | - | - | - | - | - | - | - | - | - | - | - | - | 0.005 | 0.006 | 0.004 | |
| Jizzakh | - | - | - | - | - | - | - | - | - | - | - | - | - | - | - | - | - | - | - | - | - | - | 0.013 | 0.006 | 0.002 | |
| Kashkadarya | - | - | - | - | - | - | - | - | - | - | - | - | - | - | - | - | - | - | - | - | - | - | 0.013 | 0.012 | 0.007 | |
| Navoi | - | - | - | - | - | - | - | - | - | - | - | - | - | - | - | - | - | - | - | - | - | - | 0.000 | 0.006 | 0.000 | |
| Namangan | - | - | - | - | - | - | - | - | - | - | - | - | - | - | - | - | - | - | - | - | - | - | 0.017 | 0.020 | 0.010 | |
| Samarkand | - | - | - | - | - | - | - | - | - | - | - | - | - | - | - | - | - | - | - | - | - | - | 0.022 | 0.021 | 0.018 | |
| Surkhandarya | - | - | - | - | - | - | - | - | - | - | - | - | - | - | - | - | - | - | - | - | - | - | 0.009 | 0.006 | 0.005 | |
| Syrdarya | - | - | - | - | - | - | - | - | - | - | - | - | - | - | - | - | - | - | - | - | - | - | 0.026 | 0.016 | 0.006 | |
| Tashkent | - | - | - | - | - | - | - | - | - | - | - | - | - | - | - | - | - | - | - | - | - | - | 0.037 | 0.014 | 0.016 | |
| Fergana | - | - | - | - | - | - | - | - | - | - | - | - | - | - | - | - | - | - | - | - | - | - | 0.038 | 0.021 | 0.016 | |
| Khorezm | - | - | - | - | - | - | - | - | - | - | - | - | - | - | - | - | - | - | - | - | - | - | 0.006 | 0.004 | 0.010 | |
| Tashkent city | - | - | - | - | - | - | - | - | - | - | - | - | - | - | - | - | - | - | - | - | - | - | 0.027 | 0.010 | 0.008 | |
| e) 18 years and older. | - | - | - | - | - | - | - | - | - | - | - | 0.143 | 0.159 | 0.176 | 0.174 | 0.169 | 0.161 | 0.171 | 0.172 | 0.167 | 0.113 | 0.130 | 0.156 | 0.156 | 0.157 | |
| Republic of Karakalpakstan | - | - | - | - | - | - | - | - | - | - | - | - | - | - | - | - | - | - | - | - | - | - | 0.084 | 0.084 | 0.097 | |
| regions: | ||||||||||||||||||||||||||
| Andijan | - | - | - | - | - | - | - | - | - | - | - | - | - | - | - | - | - | - | - | - | - | - | 0.177 | 0.163 | 0.187 | |
| Bukhara | - | - | - | - | - | - | - | - | - | - | - | - | - | - | - | - | - | - | - | - | - | - | 0.115 | 0.134 | 0.127 | |
| Jizzakh | - | - | - | - | - | - | - | - | - | - | - | - | - | - | - | - | - | - | - | - | - | - | 0.090 | 0.107 | 0.122 | |
| Kashkadarya | - | - | - | - | - | - | - | - | - | - | - | - | - | - | - | - | - | - | - | - | - | - | 0.087 | 0.106 | 0.114 | |
| Navoi | - | - | - | - | - | - | - | - | - | - | - | - | - | - | - | - | - | - | - | - | - | - | 0.061 | 0.070 | 0.073 | |
| Namangan | - | - | - | - | - | - | - | - | - | - | - | - | - | - | - | - | - | - | - | - | - | - | 0.135 | 0.112 | 0.113 | |
| Samarkand | - | - | - | - | - | - | - | - | - | - | - | - | - | - | - | - | - | - | - | - | - | - | 0.163 | 0.161 | 0.154 | |
| Surkhandarya | - | - | - | - | - | - | - | - | - | - | - | - | - | - | - | - | - | - | - | - | - | - | 0.125 | 0.148 | 0.136 | |
| Syrdarya | - | - | - | - | - | - | - | - | - | - | - | - | - | - | - | - | - | - | - | - | - | - | 0.199 | 0.218 | 0.193 | |
| Tashkent | - | - | - | - | - | - | - | - | - | - | - | - | - | - | - | - | - | - | - | - | - | - | 0.296 | 0.289 | 0.283 | |
| Fergana | - | - | - | - | - | - | - | - | - | - | - | - | - | - | - | - | - | - | - | - | - | - | 0.130 | 0.138 | 0.132 | |
| Khorezm | - | - | - | - | - | - | - | - | - | - | - | - | - | - | - | - | - | - | - | - | - | - | 0.180 | 0.150 | 0.188 | |
| Tashkent city | - | - | - | - | - | - | - | - | - | - | - | - | - | - | - | - | - | - | - | - | - | - | 0.247 | 0.233 | 0.212 | |
| 6 | Indicator 3.3.2. Tuberculosis incidence per 100,000 population: | |||||||||||||||||||||||||
| a) total; | 65.5 | 73.3 | 79.4 | 77.6 | 75.8 | 76.0 | 70.4 | 67.5 | 64.7 | 63.8 | 60.9 | 53.1 | 51.6 | 50.8 | 47.8 | 46.9 | 45.3 | 44.9 | 43.0 | 43.2 | 31.8 | 34.8 | 35.3 | 33.9 | 33.5 | |
| Republic of Karakalpakstan | - | - | - | - | - | - | - | - | - | - | - | - | - | - | - | - | - | - | - | - | - | - | 60.0 | 60.2 | 55.3 | |
| regions: | ||||||||||||||||||||||||||
| Andijan | - | - | - | - | - | - | - | - | - | - | - | - | - | - | - | - | - | - | - | - | - | - | 36.1 | 33.3 | 35.2 | |
| Bukhara | - | - | - | - | - | - | - | - | - | - | - | - | - | - | - | - | - | - | - | - | - | - | 29.9 | 29.4 | 28.5 | |
| Jizzakh | - | - | - | - | - | - | - | - | - | - | - | - | - | - | - | - | - | - | - | - | - | - | 37.9 | 39.8 | 36.5 | |
| Kashkadarya | - | - | - | - | - | - | - | - | - | - | - | - | - | - | - | - | - | - | - | - | - | - | 30.2 | 28.8 | 26.7 | |
| Navoi | - | - | - | - | - | - | - | - | - | - | - | - | - | - | - | - | - | - | - | - | - | - | 31.7 | 32.1 | 29.8 | |
| Namangan | - | - | - | - | - | - | - | - | - | - | - | - | - | - | - | - | - | - | - | - | - | - | 34.5 | 33.6 | 34.1 | |
| Samarkand | - | - | - | - | - | - | - | - | - | - | - | - | - | - | - | - | - | - | - | - | - | - | 42.1 | 41.5 | 41.3 | |
| Surkhandarya | - | - | - | - | - | - | - | - | - | - | - | - | - | - | - | - | - | - | - | - | - | - | 32.5 | 29.3 | 30.5 | |
| Syrdarya | - | - | - | - | - | - | - | - | - | - | - | - | - | - | - | - | - | - | - | - | - | - | 33.0 | 27.3 | 29.8 | |
| Tashkent | - | - | - | - | - | - | - | - | - | - | - | - | - | - | - | - | - | - | - | - | - | - | 34.2 | 31.9 | 30.4 | |
| Fergana | - | - | - | - | - | - | - | - | - | - | - | - | - | - | - | - | - | - | - | - | - | - | 28.4 | 29.3 | 29.5 | |
| Khorezm | - | - | - | - | - | - | - | - | - | - | - | - | - | - | - | - | - | - | - | - | - | - | 32.0 | 30.6 | 32.3 | |
| Tashkent city | - | - | - | - | - | - | - | - | - | - | - | - | - | - | - | - | - | - | - | - | - | - | 35.1 | 30.3 | 30.2 | |
| b) women; | 45.1 | 46.2 | 47.3 | 45.5 | 46.9 | 40.8 | 41.7 | 43.2 | 45.7 | 45.8 | 44.5 | 41.6 | 40.8 | 38.7 | 39.9 | 40.1 | 40.3 | 39.6 | 39.5 | 35.6 | 29.6 | 33.3 | 33.8 | 32.5 | 32.6 | |
| Republic of Karakalpakstan | - | - | - | - | - | - | - | - | - | - | - | - | - | - | - | - | - | - | - | - | - | - | 60.0 | 60.8 | 56.3 | |
| regions: | ||||||||||||||||||||||||||
| Andijan | - | - | - | - | - | - | - | - | - | - | - | - | - | - | - | - | - | - | - | - | - | - | 34.1 | 31.6 | 33.8 | |
| Bukhara | - | - | - | - | - | - | - | - | - | - | - | - | - | - | - | - | - | - | - | - | - | - | 34.4 | 29.2 | 31.2 | |
| Jizzakh | - | - | - | - | - | - | - | - | - | - | - | - | - | - | - | - | - | - | - | - | - | - | 36.3 | 39.4 | 35.3 | |
| Kashkadarya | - | - | - | - | - | - | - | - | - | - | - | - | - | - | - | - | - | - | - | - | - | - | 26.7 | 26.1 | 24.8 | |
| Navoi | - | - | - | - | - | - | - | - | - | - | - | - | - | - | - | - | - | - | - | - | - | - | 31.2 | 30.8 | 29.7 | |
| Namangan | - | - | - | - | - | - | - | - | - | - | - | - | - | - | - | - | - | - | - | - | - | - | 32.8 | 32.9 | 33.8 | |
| Samarkand | - | - | - | - | - | - | - | - | - | - | - | - | - | - | - | - | - | - | - | - | - | - | 45.4 | 43.4 | 41.1 | |
| Surkhandarya | - | - | - | - | - | - | - | - | - | - | - | - | - | - | - | - | - | - | - | - | - | - | 28.4 | 25.6 | 26.4 | |
| Syrdarya | - | - | - | - | - | - | - | - | - | - | - | - | - | - | - | - | - | - | - | - | - | - | 29.2 | 23.7 | 27.2 | |
| Tashkent | - | - | - | - | - | - | - | - | - | - | - | - | - | - | - | - | - | - | - | - | - | - | 29.5 | 28.6 | 26.8 | |
| Fergana | - | - | - | - | - | - | - | - | - | - | - | - | - | - | - | - | - | - | - | - | - | - | 29.5 | 28.1 | 31.8 | |
| Khorezm | - | - | - | - | - | - | - | - | - | - | - | - | - | - | - | - | - | - | - | - | - | - | 28.0 | 26.6 | 31.6 | |
| Tashkent city | - | - | - | - | - | - | - | - | - | - | - | - | - | - | - | - | - | - | - | - | - | - | 29.3 | 28.5 | 27.7 | |
| c) men; | 50.6 | 51.3 | 52.4 | 51.8 | 50.1 | 50.3 | 51.2 | 54.7 | 55.6 | 50.7 | 51.4 | 52.9 | 53.3 | 51.6 | 52.4 | 53.6 | 50.3 | 50.2 | 46.4 | 46.9 | 34.0 | 36.3 | 36.8 | 35.3 | 34.4 | |
| Republic of Karakalpakstan | - | - | - | - | - | - | - | - | - | - | - | - | - | - | - | - | - | - | - | - | - | - | 246.1 | 59.6 | 54.2 | |
| regions: | ||||||||||||||||||||||||||
| Andijan | - | - | - | - | - | - | - | - | - | - | - | - | - | - | - | - | - | - | - | - | - | - | 274.1 | 35.0 | 36.6 | |
| Bukhara | - | - | - | - | - | - | - | - | - | - | - | - | - | - | - | - | - | - | - | - | - | - | 56.4 | 29.5 | 25.8 | |
| Jizzakh | - | - | - | - | - | - | - | - | - | - | - | - | - | - | - | - | - | - | - | - | - | - | 120.8 | 40.3 | 37.7 | |
| Kashkadarya | - | - | - | - | - | - | - | - | - | - | - | - | - | - | - | - | - | - | - | - | - | - | 279.1 | 31.5 | 28.5 | |
| Navoi | - | - | - | - | - | - | - | - | - | - | - | - | - | - | - | - | - | - | - | - | - | - | 34.0 | 33.3 | 29.8 | |
| Namangan | - | - | - | - | - | - | - | - | - | - | - | - | - | - | - | - | - | - | - | - | - | - | 398.6 | 34.3 | 34.5 | |
| Samarkand | - | - | - | - | - | - | - | - | - | - | - | - | - | - | - | - | - | - | - | - | - | - | 190.0 | 39.5 | 41.4 | |
| Surkhandarya | - | - | - | - | - | - | - | - | - | - | - | - | - | - | - | - | - | - | - | - | - | - | 89.4 | 33.0 | 34.5 | |
| Syrdarya | - | - | - | - | - | - | - | - | - | - | - | - | - | - | - | - | - | - | - | - | - | - | 39.4 | 30.8 | 32.4 | |
| Tashkent | - | - | - | - | - | - | - | - | - | - | - | - | - | - | - | - | - | - | - | - | - | - | 491.0 | 35.3 | 34.0 | |
| Fergana | - | - | - | - | - | - | - | - | - | - | - | - | - | - | - | - | - | - | - | - | - | - | 149.9 | 30.5 | 27.2 | |
| Khorezm | - | - | - | - | - | - | - | - | - | - | - | - | - | - | - | - | - | - | - | - | - | - | 35.9 | 34.5 | 33.0 | |
| Tashkent city | - | - | - | - | - | - | - | - | - | - | - | - | - | - | - | - | - | - | - | - | - | - | 41.1 | 32.3 | 32.8 | |
| d) 0-14 years old; | 31.4 | 32.8 | 33.0 | 9.4 | 8.8 | 33.0 | 32.3 | 31.4 | 31.2 | 31.6 | 31.6 | 23.6 | 22.5 | 23.0 | 21.3 | 20.1 | 22.1 | 21.0 | 21.0 | 22.2 | 17.2 | 17.4 | 13.6 | 13.4 | 13.8 | |
| Republic of Karakalpakstan | - | - | - | - | - | - | - | - | - | - | - | - | - | - | - | - | - | - | - | - | - | - | 10.5 | 9.7 | 7.8 | |
| regions: | ||||||||||||||||||||||||||
| Andijan | - | - | - | - | - | - | - | - | - | - | - | - | - | - | - | - | - | - | - | - | - | - | 7.9 | 6.0 | 9.0 | |
| Bukhara | - | - | - | - | - | - | - | - | - | - | - | - | - | - | - | - | - | - | - | - | - | - | 6.3 | 5.3 | 5.7 | |
| Jizzakh | - | - | - | - | - | - | - | - | - | - | - | - | - | - | - | - | - | - | - | - | - | - | 21.0 | 21.5 | 16.4 | |
| Kashkadarya | - | - | - | - | - | - | - | - | - | - | - | - | - | - | - | - | - | - | - | - | - | - | 12.7 | 12.9 | 11.8 | |
| Navoi | - | - | - | - | - | - | - | - | - | - | - | - | - | - | - | - | - | - | - | - | - | - | 9.5 | 9.6 | 8.1 | |
| Namangan | - | - | - | - | - | - | - | - | - | - | - | - | - | - | - | - | - | - | - | - | - | - | 10.2 | 7.8 | 8.6 | |
| Samarkand | - | - | - | - | - | - | - | - | - | - | - | - | - | - | - | - | - | - | - | - | - | - | 16.5 | 16.4 | 19.1 | |
| Surkhandarya | - | - | - | - | - | - | - | - | - | - | - | - | - | - | - | - | - | - | - | - | - | - | 26.6 | 26.6 | 24.7 | |
| Syrdarya | - | - | - | - | - | - | - | - | - | - | - | - | - | - | - | - | - | - | - | - | - | - | 13.6 | 12.5 | 8.3 | |
| Tashkent | - | - | - | - | - | - | - | - | - | - | - | - | - | - | - | - | - | - | - | - | - | - | 18.6 | 20.4 | 23.3 | |
| Fergana | - | - | - | - | - | - | - | - | - | - | - | - | - | - | - | - | - | - | - | - | - | - | 8.1 | 7.7 | 8.9 | |
| Khorezm | - | - | - | - | - | - | - | - | - | - | - | - | - | - | - | - | - | - | - | - | - | - | 9.7 | 8.6 | 16.5 | |
| Tashkent city | - | - | - | - | - | - | - | - | - | - | - | - | - | - | - | - | - | - | - | - | - | - | 16.2 | 19.5 | 14.7 | |
| e) 15-17 years old; | 46.7 | 45.2 | 45.4 | 44.8 | 45.2 | 41.5 | 41.1 | 33.6 | 32.4 | 30.1 | 28.1 | 27.2 | 23.4 | 23.4 | 23.8 | 22.0 | 23.4 | 23.2 | 22.4 | 24.7 | 18.9 | 22.2 | 18.5 | 15.1 | 20.6 | |
| Republic of Karakalpakstan | - | - | - | - | - | - | - | - | - | - | - | - | - | - | - | - | - | - | - | - | - | - | 43.7 | 46.8 | 64.6 | |
| regions: | ||||||||||||||||||||||||||
| Andijan | - | - | - | - | - | - | - | - | - | - | - | - | - | - | - | - | - | - | - | - | - | - | 22.1 | 17.3 | 21.0 | |
| Bukhara | - | - | - | - | - | - | - | - | - | - | - | - | - | - | - | - | - | - | - | - | - | - | 12.3 | 3.2 | 14.6 | |
| Jizzakh | - | - | - | - | - | - | - | - | - | - | - | - | - | - | - | - | - | - | - | - | - | - | 15.4 | 8.1 | 29.6 | |
| Kashkadarya | - | - | - | - | - | - | - | - | - | - | - | - | - | - | - | - | - | - | - | - | - | - | 16.8 | 8.3 | 12.8 | |
| Navoi | - | - | - | - | - | - | - | - | - | - | - | - | - | - | - | - | - | - | - | - | - | - | 8.5 | 4.1 | 15.7 | |
| Namangan | - | - | - | - | - | - | - | - | - | - | - | - | - | - | - | - | - | - | - | - | - | - | 13.8 | 19.1 | 21.2 | |
| Samarkand | - | - | - | - | - | - | - | - | - | - | - | - | - | - | - | - | - | - | - | - | - | - | 16.8 | 6.8 | 16.9 | |
| Surkhandarya | - | - | - | - | - | - | - | - | - | - | - | - | - | - | - | - | - | - | - | - | - | - | 20.3 | 14.8 | 13.2 | |
| Syrdarya | - | - | - | - | - | - | - | - | - | - | - | - | - | - | - | - | - | - | - | - | - | - | 18.5 | 24.1 | 12.5 | |
| Tashkent | - | - | - | - | - | - | - | - | - | - | - | - | - | - | - | - | - | - | - | - | - | - | 24.7 | 26.9 | 23.7 | |
| Fergana | - | - | - | - | - | - | - | - | - | - | - | - | - | - | - | - | - | - | - | - | - | - | 15.2 | 13.8 | 13.1 | |
| Khorezm | - | - | - | - | - | - | - | - | - | - | - | - | - | - | - | - | - | - | - | - | - | - | 5.2 | 11.1 | 19.1 | |
| Tashkent city | - | - | - | - | - | - | - | - | - | - | - | - | - | - | - | - | - | - | - | - | - | - | 20.3 | 11.4 | 22.1 | |
| f) 18 years and older. | 101.2 | 101.7 | 101.9 | 102.1 | 103.0 | 103.8 | 94.1 | 89.9 | 85.0 | 82.9 | 80.4 | 68.8 | 66.9 | 65.1 | 61.1 | 60.1 | 56.9 | 56.7 | 53.9 | 53.7 | 39.2 | 38.6 | 46.4 | 44.8 | 43.7 | |
| Republic of Karakalpakstan | - | - | - | - | - | - | - | - | - | - | - | - | - | - | - | - | - | - | - | - | - | - | 83.0 | 83.4 | 75.2 | |
| regions: | ||||||||||||||||||||||||||
| Andijan | - | - | - | - | - | - | - | - | - | - | - | - | - | - | - | - | - | - | - | - | - | - | 50.3 | 47.5 | 48.9 | |
| Bukhara | - | - | - | - | - | - | - | - | - | - | - | - | - | - | - | - | - | - | - | - | - | - | 40.6 | 41.0 | 38.9 | |
| Jizzakh | - | - | - | - | - | - | - | - | - | - | - | - | - | - | - | - | - | - | - | - | - | - | 47.9 | 51.4 | 47.2 | |
| Kashkadarya | - | - | - | - | - | - | - | - | - | - | - | - | - | - | - | - | - | - | - | - | - | - | 40.1 | 38.6 | 35.6 | |
| Navoi | - | - | - | - | - | - | - | - | - | - | - | - | - | - | - | - | - | - | - | - | - | - | 42.9 | 44.0 | 40.5 | |
| Namangan | - | - | - | - | - | - | - | - | - | - | - | - | - | - | - | - | - | - | - | - | - | - | 47.4 | 47.0 | 47.6 | |
| Samarkand | - | - | - | - | - | - | - | - | - | - | - | - | - | - | - | - | - | - | - | - | - | - | 56.8 | 56.8 | 54.6 | |
| Surkhandarya | - | - | - | - | - | - | - | - | - | - | - | - | - | - | - | - | - | - | - | - | - | - | 36.5 | 31.9 | 35.1 | |
| Syrdarya | - | - | - | - | - | - | - | - | - | - | - | - | - | - | - | - | - | - | - | - | - | - | 43.0 | 34.3 | 41.2 | |
| Tashkent | - | - | - | - | - | - | - | - | - | - | - | - | - | - | - | - | - | - | - | - | - | - | 41.4 | 37.1 | 33.9 | |
| Fergana | - | - | - | - | - | - | - | - | - | - | - | - | - | - | - | - | - | - | - | - | - | - | 38.2 | 40.1 | 40.1 | |
| Khorezm | - | - | - | - | - | - | - | - | - | - | - | - | - | - | - | - | - | - | - | - | - | - | 43.9 | 41.8 | 40.5 | |
| Tashkent city | - | - | - | - | - | - | - | - | - | - | - | - | - | - | - | - | - | - | - | - | - | - | 43.0 | 35.6 | 36.6 | |
| 7 | Indicator 3.3.3 Malaria incidence per 1,000 population. | 0.5 | 0.3 | 0.3 | 0.3 | 0.2 | 0.4 | 0.3 | 0.3 | 0.1 | 0.0 | 0.0 | 0.0 | 0.0 | 0.0 | 0.0 | 0.0 | 0.0 | 0.0 | 0.0 | 0.0 | 0.0 | 0.0 | 0.0 | 0.0 | 0.0 |
| 8 | Indicator 3.3.4. Hepatitis B incidence per 100,000 population. | 29.8 | 24.0 | 18.8 | 13.7 | 11.6 | 8.9 | 7.3 | 5.2 | 3.5 | 2.5 | 2.0 | 2.0 | 1.8 | 1.5 | 1.1 | 1.1 | 0.8 | 0.8 | 0.6 | 0.60 | 0.20 | 0.30 | 0.34 | 0.29 | 0.19 |
| Republic of Karakalpakstan | - | - | - | - | - | - | - | - | - | - | - | - | - | - | - | - | - | - | - | - | - | - | 0.76 | 0.25 | 0.74 | |
| regions: | ||||||||||||||||||||||||||
| Andijan | - | - | - | - | - | - | - | - | - | - | - | - | - | - | - | - | - | - | - | - | - | - | 0.12 | 0.09 | 0.06 | |
| Bukhara | - | - | - | - | - | - | - | - | - | - | - | - | - | - | - | - | - | - | - | - | - | - | 0.55 | 0.44 | 0.29 | |
| Jizzakh | - | - | - | - | - | - | - | - | - | - | - | - | - | - | - | - | - | - | - | - | - | - | 0.89 | 0.40 | 0.26 | |
| Kashkadarya | - | - | - | - | - | - | - | - | - | - | - | - | - | - | - | - | - | - | - | - | - | - | 0.90 | 0.74 | 0.47 | |
| Navoi | - | - | - | - | - | - | - | - | - | - | - | - | - | - | - | - | - | - | - | - | - | - | 0.48 | 0.75 | 0.46 | |
| Namangan | - | - | - | - | - | - | - | - | - | - | - | - | - | - | - | - | - | - | - | - | - | - | 0.03 | 0.10 | 0.06 | |
| Samarkand | - | - | - | - | - | - | - | - | - | - | - | - | - | - | - | - | - | - | - | - | - | - | 0.15 | 0.29 | 0.02 | |
| Surkhandarya | - | - | - | - | - | - | - | - | - | - | - | - | - | - | - | - | - | - | - | - | - | - | 0.32 | 0.18 | 0.03 | |
| Syrdarya | - | - | - | - | - | - | - | - | - | - | - | - | - | - | - | - | - | - | - | - | - | - | 0.00 | 0.00 | 0.00 | |
| Tashkent | - | - | - | - | - | - | - | - | - | - | - | - | - | - | - | - | - | - | - | - | - | - | 0.17 | 0.23 | 0.06 | |
| Fergana | - | - | - | - | - | - | - | - | - | - | - | - | - | - | - | - | - | - | - | - | - | - | 0.08 | 0.07 | 0.12 | |
| Khorezm | - | - | - | - | - | - | - | - | - | - | - | - | - | - | - | - | - | - | - | - | - | - | 0.10 | 0.10 | 0.00 | |
| Tashkent city | - | - | - | - | - | - | - | - | - | - | - | - | - | - | - | - | - | - | - | - | - | - | 0.55 | 0.57 | 0.39 | |
| 9 | Indicator 3.4.1. Mortality rate attributed to cardiovascular disease, cancer, diabetes or chronic respiratory disease: | 368.8 | 340.0 | 351.8 | 347.9 | 342.5 | 362.9 | 350.3 | 332.7 | 320.6 | 309.7 | 300.7 | 301.0 | 297.0 | 288.1 | 288.6 | 279.7 | 281.2 | 279.3 | 264.9 | 252.6 | 271.6 | 372.7 | 359.7 | 364.2 | 355.5 |
| 1) circulatory system diseases (I00-I99); | 270.4 | 262.8 | 274.3 | 269.3 | 257.1 | 274.7 | 265.6 | 252.8 | 245.8 | 232.4 | 227.7 | 226.9 | 222.2 | 214.0 | 213.1 | 202.1 | 203.9 | 201.1 | 191.2 | 181.0 | 200.4 | 308.5 | 301.1 | 299.6 | 290.4 | |
| a) women; | - | - | - | - | - | - | - | - | - | - | - | - | - | - | - | - | - | - | - | - | - | - | - | 275.6 | 266.2 | |
| b) men. | - | - | - | - | - | - | - | - | - | - | - | - | - | - | - | - | - | - | - | - | - | - | - | 323.2 | 314.2 | |
| 2) malignant neoplasms (C00-C97); | 57.3 | 54.5 | 53.1 | 53.5 | 52.8 | 53.7 | 50.9 | 49.5 | 42.2 | 48.2 | 45.2 | 47.1 | 46.7 | 46.2 | 48.1 | 49.8 | 50.6 | 51.3 | 48.2 | 48.3 | 42.1 | 38.4 | 38.3 | 41.9 | 41.2 | |
| a) women; | - | - | - | - | - | - | - | - | - | - | - | - | - | - | - | - | - | - | - | - | - | - | - | 43.3 | 43.3 | |
| b) men. | - | - | - | - | - | - | - | - | - | - | - | - | - | - | - | - | - | - | - | - | - | - | - | 39.3 | 39.2 | |
| 3) type 2 diabetes mellitus (E10-E14); | 16.1 | 21.0 | 16.7 | 18.1 | 19.4 | 20.2 | 21.6 | 21.4 | 23.4 | 20.8 | 20.4 | 19.2 | 21.7 | 21.2 | 21.5 | 22.3 | 21.4 | 21.4 | 19.7 | 19.5 | 25.1 | 18.3 | 14.6 | 17.8 | 18.6 | |
| a) women; | - | - | - | - | - | - | - | - | - | - | - | - | - | - | - | - | - | - | - | - | - | - | - | 18.9 | 19.7 | |
| b) men. | - | - | - | - | - | - | - | - | - | - | - | - | - | - | - | - | - | - | - | - | - | - | - | 16.7 | 17.4 | |
| 4) chronic respiratory disease (J30-J99). | 25.0 | 1.7 | 7.7 | 7.1 | 13.2 | 14.3 | 12.3 | 9.0 | 9.2 | 8.3 | 7.4 | 7.7 | 6.5 | 6.7 | 5.9 | 5.6 | 5.2 | 5.6 | 5.8 | 3.8 | 4.0 | 7.5 | 5.7 | 4.9 | 5.3 | |
| a) women; | - | - | - | - | - | - | - | - | - | - | - | - | - | - | - | - | - | - | - | - | - | - | - | 4.5 | 4.7 | |
| b) men. | - | - | - | - | - | - | - | - | - | - | - | - | - | - | - | - | - | - | - | - | - | - | - | 5.4 | 5.9 | |
| 10 | Indicator 3.4.2. Suicide mortality rate per 100,000 population, by sex: | |||||||||||||||||||||||||
| a) total; | 7.8 | 7.6 | 6.2 | 5.5 | 4.6 | 4.6 | 4.7 | 4.7 | 4.8 | 5 | 5.1 | 5.6 | 6.2 | 6.4 | 6.8 | 7.6 | 7.7 | 7.5 | 6.9 | 6.9 | 6.2 | 6.4 | 4.5 | 5.0 | 5.4 | |
| b) women; | - | - | - | - | - | - | - | - | - | - | 3.2 | 3.5 | 4.1 | 4.2 | 4.5 | 5.1 | 5.1 | 5.0 | 4.9 | 5.2 | 4.7 | 4.7 | 3.3 | 3.5 | 3.7 | |
| c) men; | - | - | - | - | - | - | - | - | - | - | 7.1 | 7.6 | 8.2 | 8.7 | 9.1 | 10.2 | 10.4 | 9.9 | 8.9 | 8.6 | 7.6 | 8.2 | 5.7 | 6.5 | 7.1 | |
| Republic of Karakalpakstan | - | - | - | - | - | - | - | - | - | - | - | - | - | - | - | - | - | - | - | - | - | - | - | - | 10.6 | |
| regions: | ||||||||||||||||||||||||||
| Andijan | - | - | - | - | - | - | - | - | - | - | - | - | - | - | - | - | - | - | - | - | - | - | - | - | 3.8 | |
| Bukhara | - | - | - | - | - | - | - | - | - | - | - | - | - | - | - | - | - | - | - | - | - | - | - | - | 5.8 | |
| Jizzakh | - | - | - | - | - | - | - | - | - | - | - | - | - | - | - | - | - | - | - | - | - | - | - | - | 5.0 | |
| Kashkadarya | - | - | - | - | - | - | - | - | - | - | - | - | - | - | - | - | - | - | - | - | - | - | - | - | 4.8 | |
| Navoi | - | - | - | - | - | - | - | - | - | - | - | - | - | - | - | - | - | - | - | - | - | - | - | - | 10.0 | |
| Namangan | - | - | - | - | - | - | - | - | - | - | - | - | - | - | - | - | - | - | - | - | - | - | - | - | 1.0 | |
| Samarkand | - | - | - | - | - | - | - | - | - | - | - | - | - | - | - | - | - | - | - | - | - | - | - | - | 6.9 | |
| Surkhandarya | - | - | - | - | - | - | - | - | - | - | - | - | - | - | - | - | - | - | - | - | - | - | - | - | 3.3 | |
| Syrdarya | - | - | - | - | - | - | - | - | - | - | - | - | - | - | - | - | - | - | - | - | - | - | - | - | 7.9 | |
| Tashkent | - | - | - | - | - | - | - | - | - | - | - | - | - | - | - | - | - | - | - | - | - | - | - | - | 10.1 | |
| Fergana | - | - | - | - | - | - | - | - | - | - | - | - | - | - | - | - | - | - | - | - | - | - | - | - | 6.1 | |
| Khorezm | - | - | - | - | - | - | - | - | - | - | - | - | - | - | - | - | - | - | - | - | - | - | - | - | 5.0 | |
| Tashkent city | - | - | - | - | - | - | - | - | - | - | - | - | - | - | - | - | - | - | - | - | - | - | - | - | 0.5 | |
| 11 | Indicator 3.5.1.1. The incidence of drug addiction diseases per 100,000 population: | |||||||||||||||||||||||||
| a) drug addiction; | - | - | - | - | - | - | - | - | - | - | 7.6 | 5.9 | 4.6 | 4.0 | 3.8 | 3.0 | 3.0 | 2.5 | 2.6 | 2.7 | 2.8 | 3.0 | 3.9 | 4.5 | 5.7 | |
| b) alcoholism; | - | - | - | - | - | - | - | - | - | - | 18.9 | 19.4 | 16.1 | 18.1 | 17.1 | 16.3 | 18.0 | 21.0 | 19.3 | 24.1 | 21.0 | 21.7 | 17.9 | 18.5 | 17.3 | |
| c) substance abuse. | - | - | - | - | - | - | - | - | - | - | 0.1 | 0.1 | 0.1 | 0.1 | 0.1 | 0.1 | 0.1 | 0.1 | 0.1 | 0.2 | 0.2 | 0.2 | 0.4 | 0.4 | 0.5 | |
| 12 | Indicator 3.5.2. Alcohol consumption per capita aged 15 years and older in liters of pure alcohol within a calendar year. | - | - | - | - | - | 7.3 | 5.1 | 5.8 | 7.6 | 8.3 | 7.1 | 6.9 | 6.5 | 6.6 | 7.0 | 7.0 | 7.0 | 6.3 | 6.4 | 4.9 | 4.6 | 5.0 | 6.5 | 4.0 | 4.8 |
| 13 | Indicator 3.6.1. Death rate due to road traffic injuries. | 8.6 | 8.6 | 8.2 | 8.0 | 7.8 | 8.2 | 8.0 | 8.4 | 8.0 | 7.8 | 7.6 | 7.4 | 7.7 | 7.7 | 7.8 | 8.1 | 7.9 | 7.6 | 6.9 | 6.2 | 5.7 | 6.9 | 6.6 | 6.0 | 8.8 |
| a) women; | - | - | - | - | - | - | - | - | - | - | - | - | - | - | - | - | - | - | - | - | - | - | - | 3.1 | 3.8 | |
| b) men; | - | - | - | - | - | - | - | - | - | - | - | - | - | - | - | - | - | - | - | - | - | - | - | 8.8 | 13.6 | |
| 14 | Indicator 3.7.1. Proportion of women of reproductive age (aged 15–49 years) who have their need for family planning satisfied with modern methods. 1) | - | - | - | - | - | - | - | - | - | - | - | - | - | - | - | - | - | - | - | - | - | - | 80.8 | - | - |
| a) urban; | - | - | - | - | - | - | - | - | - | - | - | - | - | - | - | - | - | - | - | - | - | - | 79.5 | - | - | |
| b) rural; | - | - | - | - | - | - | - | - | - | - | - | - | - | - | - | - | - | - | - | - | - | - | 81.8 | - | - | |
| 15 | Indicator 3.7.1.1. Coverage of women of reproductive age (15-49 years) with modern contraceptives, as a proportion of their number. | - | - | - | 60.6 | 64.2 | 61.1 | 59.8 | 59.9 | 56.3 | 55.2 | 52.2 | 56.6 | 57.4 | 57.6 | 47.7 | 49.5 | 52.9 | 52.3 | 51.0 | 48.1 | 49.6 | 46.9 | 47.1 | 45.7 | 45.5 |
| Republic of Karakalpakstan | - | - | - | - | - | - | - | - | - | - | - | - | - | - | - | - | - | - | - | - | - | - | 50.6 | 50.4 | 49.1 | |
| regions: | ||||||||||||||||||||||||||
| Andijan | - | - | - | - | - | - | - | - | - | - | - | - | - | - | - | - | - | - | - | - | - | - | 45.1 | 48.8 | 51.1 | |
| Bukhara | - | - | - | - | - | - | - | - | - | - | - | - | - | - | - | - | - | - | - | - | - | - | 25.0 | 28.1 | 32.5 | |
| Jizzakh | - | - | - | - | - | - | - | - | - | - | - | - | - | - | - | - | - | - | - | - | - | - | 49.7 | 54.0 | 47.9 | |
| Kashkadarya | - | - | - | - | - | - | - | - | - | - | - | - | - | - | - | - | - | - | - | - | - | - | 49.0 | 37.2 | 41.6 | |
| Navoi | - | - | - | - | - | - | - | - | - | - | - | - | - | - | - | - | - | - | - | - | - | - | 62.3 | 62.5 | 64.6 | |
| Namangan | - | - | - | - | - | - | - | - | - | - | - | - | - | - | - | - | - | - | - | - | - | - | 51.2 | 53.1 | 53.3 | |
| Samarkand | - | - | - | - | - | - | - | - | - | - | - | - | - | - | - | - | - | - | - | - | - | - | 40.9 | 42.1 | 41.3 | |
| Surkhandarya | - | - | - | - | - | - | - | - | - | - | - | - | - | - | - | - | - | - | - | - | - | - | 48.4 | 35.7 | 32.6 | |
| Syrdarya | - | - | - | - | - | - | - | - | - | - | - | - | - | - | - | - | - | - | - | - | - | - | 46.4 | 45.8 | 48.1 | |
| Tashkent | - | - | - | - | - | - | - | - | - | - | - | - | - | - | - | - | - | - | - | - | - | - | 51.8 | 51.0 | 49.6 | |
| Fergana | - | - | - | - | - | - | - | - | - | - | - | - | - | - | - | - | - | - | - | - | - | - | 46.1 | 46.3 | 43.2 | |
| Khorezm | - | - | - | - | - | - | - | - | - | - | - | - | - | - | - | - | - | - | - | - | - | - | 57.2 | 57.0 | 55.2 | |
| Tashkent city | - | - | - | - | - | - | - | - | - | - | - | - | - | - | - | - | - | - | - | - | - | - | 45.5 | 44.6 | 44.7 | |
| 16 | Indicator 3.7.2. Adolescent birth rate (aged 15-19 years) per 1,000 women in that age group. | 21.1 | 17.3 | 15.1 | 12.4 | 9.5 | 9.1 | 8.9 | 9.4 | 9.9 | 20.5 | 23.6 | 24.3 | 24.6 | 23.7 | 24.2 | 23.8 | 21.0 | 19.0 | 21.9 | 24.3 | 26.3 | 34.3 | 35.8 | 36.0 | 36.6 |
| a) urban; | - | - | - | - | - | - | - | - | - | - | - | - | - | - | - | - | - | - | - | - | - | - | - | 36.8 | 37.2 | |
| b) rural; | - | - | - | - | - | - | - | - | - | - | - | - | - | - | - | - | - | - | - | - | - | - | - | 35.2 | 36.1 | |
| Republic of Karakalpakstan | - | - | - | - | - | - | - | - | - | - | - | - | - | - | - | - | - | - | - | - | - | - | - | 15.2 | 14.9 | |
| regions: | ||||||||||||||||||||||||||
| Andijan | - | - | - | - | - | - | - | - | - | - | - | - | - | - | - | - | - | - | - | - | - | - | - | 42.1 | 44.0 | |
| Bukhara | - | - | - | - | - | - | - | - | - | - | - | - | - | - | - | - | - | - | - | - | - | - | - | 24.4 | 25.0 | |
| Jizzakh | - | - | - | - | - | - | - | - | - | - | - | - | - | - | - | - | - | - | - | - | - | - | - | 22.3 | 23.2 | |
| Kashkadarya | - | - | - | - | - | - | - | - | - | - | - | - | - | - | - | - | - | - | - | - | - | - | - | 40.4 | 42.0 | |
| Navoi | - | - | - | - | - | - | - | - | - | - | - | - | - | - | - | - | - | - | - | - | - | - | - | 19.7 | 19.7 | |
| Namangan | - | - | - | - | - | - | - | - | - | - | - | - | - | - | - | - | - | - | - | - | - | - | - | 50.6 | 52.1 | |
| Samarkand | - | - | - | - | - | - | - | - | - | - | - | - | - | - | - | - | - | - | - | - | - | - | - | 51.5 | 50.8 | |
| Surkhandarya | - | - | - | - | - | - | - | - | - | - | - | - | - | - | - | - | - | - | - | - | - | - | - | 40.3 | 41.6 | |
| Syrdarya | - | - | - | - | - | - | - | - | - | - | - | - | - | - | - | - | - | - | - | - | - | - | - | 22.3 | 22.5 | |
| Tashkent | - | - | - | - | - | - | - | - | - | - | - | - | - | - | - | - | - | - | - | - | - | - | - | 26.0 | 27.2 | |
| Fergana | - | - | - | - | - | - | - | - | - | - | - | - | - | - | - | - | - | - | - | - | - | - | - | 49.8 | 51.4 | |
| Khorezm | - | - | - | - | - | - | - | - | - | - | - | - | - | - | - | - | - | - | - | - | - | - | - | 17.5 | 19.3 | |
| Tashkent city | - | - | - | - | - | - | - | - | - | - | - | - | - | - | - | - | - | - | - | - | - | - | - | 26.6 | 23.1 | |
| 17 | Indicator 3.8.2. Proportion of population with large household expenditures on health as a share of total household expenditure: | |||||||||||||||||||||||||
| a) more than 10% of expenses; | 10.1 | 9.4 | 8.7 | 9.4 | 9.1 | 9.0 | 7.3 | 6.8 | 7.1 | 9.5 | 9.7 | 9.2 | 7.7 | 7.3 | 8.7 | 10.9 | 10.9 | 12.5 | 13.8 | 13.2 | 18.2 | 23.8 | 9.7 | 9.8 | 8.5 | |
| b) more than 25% of expenses | 3.7 | 3.8 | 3.0 | 3.3 | 3.5 | 3.1 | 2.4 | 2.6 | 2.2 | 3.3 | 3.0 | 3.3 | 2.7 | 1.7 | 2.3 | 2.2 | 2.1 | 2.5 | 3.0 | 3.4 | 2.9 | 8.8 | 2.1 | 2.1 | 1.2 | |
| 18 | Indicator 3.9.1. Mortality from diseases caused by household and ambient air pollution per 100,000 population. | - | - | - | - | 0.553 | 0.386 | 0.415 | 0.283 | 0.370 | 0.490 | 0.273 | 0.228 | 0.198 | 0.225 | 0.195 | 0.227 | 0.192 | 0.207 | 0.200 | 0.186 | 0.984 | 0.790 | 0.115 | 0.203 | 0.215 |
| a) women; | - | - | - | - | - | - | - | - | - | - | - | - | - | - | - | - | - | - | - | - | - | - | - | 0.160 | 0.108 | |
| b) men; | - | - | - | - | - | - | - | - | - | - | - | - | - | - | - | - | - | - | - | - | - | - | - | 0.246 | 0.321 | |
| Republic of Karakalpakstan | - | - | - | - | - | - | - | - | - | - | - | - | - | - | - | - | - | - | - | - | - | - | - | - | 1.081 | |
| regions: | ||||||||||||||||||||||||||
| Andijan | - | - | - | - | - | - | - | - | - | - | - | - | - | - | - | - | - | - | - | - | - | - | - | - | 0.000 | |
| Bukhara | - | - | - | - | - | - | - | - | - | - | - | - | - | - | - | - | - | - | - | - | - | - | - | - | 0.048 | |
| Jizzakh | - | - | - | - | - | - | - | - | - | - | - | - | - | - | - | - | - | - | - | - | - | - | - | - | 0.129 | |
| Kashkadarya | - | - | - | - | - | - | - | - | - | - | - | - | - | - | - | - | - | - | - | - | - | - | - | - | 0.137 | |
| Navoi | - | - | - | - | - | - | - | - | - | - | - | - | - | - | - | - | - | - | - | - | - | - | - | - | 0.091 | |
| Namangan | - | - | - | - | - | - | - | - | - | - | - | - | - | - | - | - | - | - | - | - | - | - | - | - | 0.032 | |
| Samarkand | - | - | - | - | - | - | - | - | - | - | - | - | - | - | - | - | - | - | - | - | - | - | - | - | 0.324 | |
| Surkhandarya | - | - | - | - | - | - | - | - | - | - | - | - | - | - | - | - | - | - | - | - | - | - | - | - | 0.000 | |
| Syrdarya | - | - | - | - | - | - | - | - | - | - | - | - | - | - | - | - | - | - | - | - | - | - | - | - | 0.000 | |
| Tashkent | - | - | - | - | - | - | - | - | - | - | - | - | - | - | - | - | - | - | - | - | - | - | - | - | 0.160 | |
| Fergana | - | - | - | - | - | - | - | - | - | - | - | - | - | - | - | - | - | - | - | - | - | - | - | - | 0.096 | |
| Khorezm | - | - | - | - | - | - | - | - | - | - | - | - | - | - | - | - | - | - | - | - | - | - | - | - | 0.245 | |
| Tashkent city | - | - | - | - | - | - | - | - | - | - | - | - | - | - | - | - | - | - | - | - | - | - | - | - | 0.639 | |
| 19 | Indicator 3.9.2. Mortality rate attributed to unsafe water, unsafe sanitation and lack of hygiene (exposure to unsafe Water, Sanitation and Hygiene for All (WASH) services) per 100,000 population. | - | - | - | - | 0.120 | 0.023 | 0.049 | 0.019 | 0.029 | 0.022 | 0.014 | 0.014 | 0.017 | 0.020 | 0.033 | 0.035 | 0.022 | 0.040 | 0.018 | 0.016 | 0.108 | 0.126 | 0.042 | 0.036 | 0.040 |
| a) women; | - | - | - | - | - | - | - | - | - | - | - | - | - | - | - | - | - | - | - | - | - | - | - | 0.022 | 0.016 | |
| b) men; | - | - | - | - | - | - | - | - | - | - | - | - | - | - | - | - | - | - | - | - | - | - | - | 0.049 | 0.064 | |
| Republic of Karakalpakstan | - | - | - | - | - | - | - | - | - | - | - | - | - | - | - | - | - | - | - | - | - | - | - | - | 0.000 | |
| regions: | ||||||||||||||||||||||||||
| Andijan | - | - | - | - | - | - | - | - | - | - | - | - | - | - | - | - | - | - | - | - | - | - | - | - | 0.029 | |
| Bukhara | - | - | - | - | - | - | - | - | - | - | - | - | - | - | - | - | - | - | - | - | - | - | - | - | 0.000 | |
| Jizzakh | - | - | - | - | - | - | - | - | - | - | - | - | - | - | - | - | - | - | - | - | - | - | - | - | 0.065 | |
| Kashkadarya | - | - | - | - | - | - | - | - | - | - | - | - | - | - | - | - | - | - | - | - | - | - | - | - | 0.219 | |
| Navoi | - | - | - | - | - | - | - | - | - | - | - | - | - | - | - | - | - | - | - | - | - | - | - | - | 0.000 | |
| Namangan | - | - | - | - | - | - | - | - | - | - | - | - | - | - | - | - | - | - | - | - | - | - | - | - | 0.032 | |
| Samarkand | - | - | - | - | - | - | - | - | - | - | - | - | - | - | - | - | - | - | - | - | - | - | - | - | 0.000 | |
| Surkhandarya | - | - | - | - | - | - | - | - | - | - | - | - | - | - | - | - | - | - | - | - | - | - | - | - | 0.000 | |
| Syrdarya | - | - | - | - | - | - | - | - | - | - | - | - | - | - | - | - | - | - | - | - | - | - | - | - | 0.000 | |
| Tashkent | - | - | - | - | - | - | - | - | - | - | - | - | - | - | - | - | - | - | - | - | - | - | - | - | 0.032 | |
| Fergana | - | - | - | - | - | - | - | - | - | - | - | - | - | - | - | - | - | - | - | - | - | - | - | - | 0.000 | |
| Khorezm | - | - | - | - | - | - | - | - | - | - | - | - | - | - | - | - | - | - | - | - | - | - | - | - | 0.049 | |
| Tashkent city | - | - | - | - | - | - | - | - | - | - | - | - | - | - | - | - | - | - | - | - | - | - | - | - | 0.064 | |
| 20 | Indicator 3.9.3. Mortality rate attributed to unintentional poisoning. | 1.9 | 1.9 | 1.3 | 1.2 | 1.5 | 1.6 | 1.7 | 1.3 | 1.5 | 1.4 | 1.0 | 1.1 | 1.1 | 1.2 | 1.2 | 1.1 | 1.0 | 1.3 | 1.1 | 0.9 | 0.8 | 1.3 | 1.6 | 1.3 | 1.1 |
| a) women; | - | - | - | - | - | - | - | - | - | - | - | - | - | - | - | - | - | - | - | - | - | - | - | 0.8 | 0.8 | |
| b) men; | - | - | - | - | - | - | - | - | - | - | - | - | - | - | - | - | - | - | - | - | - | - | - | 1.8 | 1.4 | |
| Republic of Karakalpakstan | - | - | - | - | - | - | - | - | - | - | - | - | - | - | - | - | - | - | - | - | - | - | - | - | 2.4 | |
| regions: | ||||||||||||||||||||||||||
| Andijan | - | - | - | - | - | - | - | - | - | - | - | - | - | - | - | - | - | - | - | - | - | - | - | - | 0.1 | |
| Bukhara | - | - | - | - | - | - | - | - | - | - | - | - | - | - | - | - | - | - | - | - | - | - | - | - | 1.2 | |
| Jizzakh | - | - | - | - | - | - | - | - | - | - | - | - | - | - | - | - | - | - | - | - | - | - | - | - | 1.7 | |
| Kashkadarya | - | - | - | - | - | - | - | - | - | - | - | - | - | - | - | - | - | - | - | - | - | - | - | - | 0.4 | |
| Navoi | - | - | - | - | - | - | - | - | - | - | - | - | - | - | - | - | - | - | - | - | - | - | - | - | 1.2 | |
| Namangan | - | - | - | - | - | - | - | - | - | - | - | - | - | - | - | - | - | - | - | - | - | - | - | - | 0.6 | |
| Samarkand | - | - | - | - | - | - | - | - | - | - | - | - | - | - | - | - | - | - | - | - | - | - | - | - | 0.6 | |
| Surkhandarya | - | - | - | - | - | - | - | - | - | - | - | - | - | - | - | - | - | - | - | - | - | - | - | - | 0.2 | |
| Syrdarya | - | - | - | - | - | - | - | - | - | - | - | - | - | - | - | - | - | - | - | - | - | - | - | - | 1.1 | |
| Tashkent | - | - | - | - | - | - | - | - | - | - | - | - | - | - | - | - | - | - | - | - | - | - | - | - | 1.0 | |
| Fergana | - | - | - | - | - | - | - | - | - | - | - | - | - | - | - | - | - | - | - | - | - | - | - | - | 2.4 | |
| Khorezm | - | - | - | - | - | - | - | - | - | - | - | - | - | - | - | - | - | - | - | - | - | - | - | - | 1.7 | |
| Tashkent city | - | - | - | - | - | - | - | - | - | - | - | - | - | - | - | - | - | - | - | - | - | - | - | - | 1.4 | |
| 21 | Indicator 3.a.1. Age-standardized prevalence of current tobacco use among persons aged 15 years and older, by sex: | |||||||||||||||||||||||||
| a) total; | - | - | - | - | - | - | - | - | - | - | - | - | - | - | - | - | - | - | 11.9 | 14.9 | 12.8 | 14.2 | 12.5 | 12.2 | 11.3 | |
| b) women; | - | - | - | - | - | - | - | - | - | - | - | - | - | - | - | - | - | - | 0.6 | 0.7 | 0.6 | 0.4 | 0.3 | 0.2 | 0.2 | |
| c) men. | - | - | - | - | - | - | - | - | - | - | - | - | - | - | - | - | - | - | 21.2 | 29.7 | 25.2 | 28.3 | 25.0 | 25.6 | 23.5 | |
| 22 | Indicator 3.b.1. Proportion of the target population covered by all vaccines included in their national programme. | 99.8 | 97.3 | 98.8 | 98.6 | 98.6 | 98.2 | 95.7 | 95.1 | 97.5 | 97.6 | 99.1 | 99.3 | 99.4 | 99.8 | 99.4 | 99.8 | 99.8 | 99.7 | 99.8 | 99.8 | 99.0 | 98.0 | 98.7 | 99.1 | 98.3 |
| 23 | Indicator 3.c.1. Health worker density and distribution: | |||||||||||||||||||||||||
| a) number of doctors of all specialties per 10,000 population; | 32.8 | 32.4 | 31.9 | 31.4 | 29.9 | 29.1 | 28.4 | 28.4 | 28 | 29 | 27.4 | 27.7 | 27.1 | 26.8 | 26.4 | 26.4 | 26.2 | 26.1 | 27.0 | 27.1 | 27.0 | 27.1 | 27.9 | 28.7 | 28.6 | |
| Republic of Karakalpakstan | - | - | - | - | - | - | - | - | - | - | - | - | - | - | - | - | - | - | - | - | - | - | 27.4 | 29.7 | 27.2 | |
| regions: | ||||||||||||||||||||||||||
| Andijan | - | - | - | - | - | - | - | - | - | - | - | - | - | - | - | - | - | - | - | - | - | - | 24.9 | 25.1 | 23.4 | |
| Bukhara | - | - | - | - | - | - | - | - | - | - | - | - | - | - | - | - | - | - | - | - | - | - | 32.5 | 32.4 | 32.3 | |
| Jizzakh | - | - | - | - | - | - | - | - | - | - | - | - | - | - | - | - | - | - | - | - | - | - | 20.6 | 18.6 | 18.1 | |
| Kashkadarya | - | - | - | - | - | - | - | - | - | - | - | - | - | - | - | - | - | - | - | - | - | - | 18.9 | 19.3 | 18.4 | |
| Navoi | - | - | - | - | - | - | - | - | - | - | - | - | - | - | - | - | - | - | - | - | - | - | 30.1 | 30.1 | 30.5 | |
| Namangan | - | - | - | - | - | - | - | - | - | - | - | - | - | - | - | - | - | - | - | - | - | - | 20.1 | 20.2 | 19.8 | |
| Samarkand | - | - | - | - | - | - | - | - | - | - | - | - | - | - | - | - | - | - | - | - | - | - | 27.6 | 28.5 | 26.7 | |
| Surkhandarya | - | - | - | - | - | - | - | - | - | - | - | - | - | - | - | - | - | - | - | - | - | - | 17.9 | 17.5 | 16.2 | |
| Syrdarya | - | - | - | - | - | - | - | - | - | - | - | - | - | - | - | - | - | - | - | - | - | - | 22.2 | 22.7 | 21.9 | |
| Tashkent | - | - | - | - | - | - | - | - | - | - | - | - | - | - | - | - | - | - | - | - | - | - | 21.9 | 22.2 | 23.8 | |
| Fergana | - | - | - | - | - | - | - | - | - | - | - | - | - | - | - | - | - | - | - | - | - | - | 22.5 | 22.6 | 23.8 | |
| Khorezm | - | - | - | - | - | - | - | - | - | - | - | - | - | - | - | - | - | - | - | - | - | - | 28.6 | 28.8 | 30.5 | |
| Tashkent city | - | - | - | - | - | - | - | - | - | - | - | - | - | - | - | - | - | - | - | - | - | - | 70.0 | 75.9 | 76.8 | |
| b) number of secondary medical personnel per 10,000 population. | 104.7 | 104.7 | 104.6 | 103.8 | 102.2 | 103 | 102.9 | 104.8 | 105.8 | 107.8 | 106.5 | 108.2 | 108.2 | 107.4 | 107.2 | 106.5 | 106.3 | 106.6 | 107.3 | 107.8 | 107.0 | 105.6 | 106.3 | 105.3 | 94.2 | |
| Republic of Karakalpakstan | - | - | - | - | - | - | - | - | - | - | - | - | - | - | - | - | - | - | - | - | - | - | 98.2 | 99.7 | 94.3 | |
| regions: | ||||||||||||||||||||||||||
| Andijan | - | - | - | - | - | - | - | - | - | - | - | - | - | - | - | - | - | - | - | - | - | - | 99.8 | 101.1 | 80.6 | |
| Bukhara | - | - | - | - | - | - | - | - | - | - | - | - | - | - | - | - | - | - | - | - | - | - | 122.2 | 122.2 | 109.0 | |
| Jizzakh | - | - | - | - | - | - | - | - | - | - | - | - | - | - | - | - | - | - | - | - | - | - | 120.1 | 108.3 | 96.5 | |
| Kashkadarya | - | - | - | - | - | - | - | - | - | - | - | - | - | - | - | - | - | - | - | - | - | - | 110.1 | 109.8 | 101.4 | |
| Navoi | - | - | - | - | - | - | - | - | - | - | - | - | - | - | - | - | - | - | - | - | - | - | 140.5 | 145.3 | 136.9 | |
| Namangan | - | - | - | - | - | - | - | - | - | - | - | - | - | - | - | - | - | - | - | - | - | - | 101.3 | 98.9 | 88.4 | |
| Samarkand | - | - | - | - | - | - | - | - | - | - | - | - | - | - | - | - | - | - | - | - | - | - | 78.1 | 80.0 | 76.6 | |
| Surkhandarya | - | - | - | - | - | - | - | - | - | - | - | - | - | - | - | - | - | - | - | - | - | - | 83.4 | 84.9 | 72.5 | |
| Syrdarya | - | - | - | - | - | - | - | - | - | - | - | - | - | - | - | - | - | - | - | - | - | - | 149.9 | 147.1 | 136.9 | |
| Tashkent | - | - | - | - | - | - | - | - | - | - | - | - | - | - | - | - | - | - | - | - | - | - | 104.1 | 103.5 | 94.4 | |
| Fergana | - | - | - | - | - | - | - | - | - | - | - | - | - | - | - | - | - | - | - | - | - | - | 111.9 | 113.0 | 96.4 | |
| Khorezm | - | - | - | - | - | - | - | - | - | - | - | - | - | - | - | - | - | - | - | - | - | - | 88.0 | 86.7 | 81.8 | |
| Tashkent city | - | - | - | - | - | - | - | - | - | - | - | - | - | - | - | - | - | - | - | - | - | - | 136.5 | 124.2 | 115.1 |
1) MICS survey results