
COVID-19 dan keyin ishlab chiqarish sanoatining tiklanishi to‘liq emas va notekis bo‘lib qolmoqda, ba'zi yuqori daromadli hududlar 2022- yilda aholi jon boshiga ishlab chiqarish sanoatida qo‘shilgan qiymat bo‘yicha rekord darajaga yetdi, eng kam rivojlangan mamlakatlarda esa bu ko‘rsatkich 2015- yildagi bazaviy ko‘rsatkichdan unchalik yuqori emas. Ma'lumotlarga ko‘ra, pandemiyadan so‘ng yuqori texnologiyali sanoat tezroq tiklandi va zarbalarga nisbatan ancha chidamli bo‘lib chiqdi, bu esa innovatsiyalarni rag‘batlantirish va texnologiyalarni barcha mamlakatlar uchun foydali bo‘lgan tarzda o‘tkazish zarurligini ko‘rsatadi.
2030- yilga kelib 9-maqsadga erishish uchun eng kam rivojlangan mamlakatlarga yordam ko‘rsatish, ilg‘or texnologiyalarga sarmoya kiritish, uglerod chiqindilarini kamaytirish va global mobil keng polosali ulanishni kengaytirish kerak.
Energiya resurslari va sanoat jarayonlarining yonishi natijasida global karbonat angidrid chiqindilari 2022- yilda 0,9 foizga oshib, yangi tarixiy maksimal
36,8 milliard tonnaga yetdi.
2022- yilda ishlab chiqarish darajasi o‘rtachadan yuqori bo‘lgan va yuqori texnologiyali sanoat tarmoqlari, asosan, avtomobilsozlik sektoridagi jonlanish va kompyuterlar, elektronika va optik mahsulotlar, shuningdek, elektr jihozlari ishlab chiqarish kabi sohalarda ishlab chiqarishning barqaror yuqori darajasi tufayli kuchli o‘sishni ko‘rsatdi.
Dunyo aholisining 95 foizi mobil keng polosali (3G yoki undan yuqori) ulanish imkoniyatiga ega va 2015-2022- yillar oralig‘ida 4G qamrovi ikki baravar ko‘payib, 88 foizga yetdi.
One of the main priorities of market reforms in Uzbekistan is the creation of a modern and reliable infrastructure. The development of infrastructure in the country is necessary not only to ensure high-quality internal communication, but for successful integration into international transport routes. Today, Uzbekistan has an extensive network of railways with a length of 6.2 thousand km, of which 4.7 thousand km are under common use. The density of railways is 13.8 km per 1,000 km2, which is comparable with the indicators of Turkey (13.4 km) and Norway (12.0 km). The total length of motor roads with hard surface is 43.8 thousand km, which is 98.7 percent of the total length of public motor roads.
Uzbekistan also has a relatively developed manufacturing industry, in 2011-2020 whose share in the structure of GDP increased from 17.4 percent to 27.4 percent, while employment in this sector at the end of 2020 reaches 11.9 percent.
In the field of innovative development, there was a tendency to a gradual weakening of innovation, as evidenced by the position of Uzbekistan in the ranking based on the Global Innovation Index for 2021 (86 place among 132 countries). For example, over the last 5 years the number of researchers (equivalent to full employment) per million inhabitants fell from 495 in 2016 to 411 in 2020. The share of expenditures on research and development in GDP fell from 0.18 percent to 0.14 percent in the period 2016-2020.
National Tasks
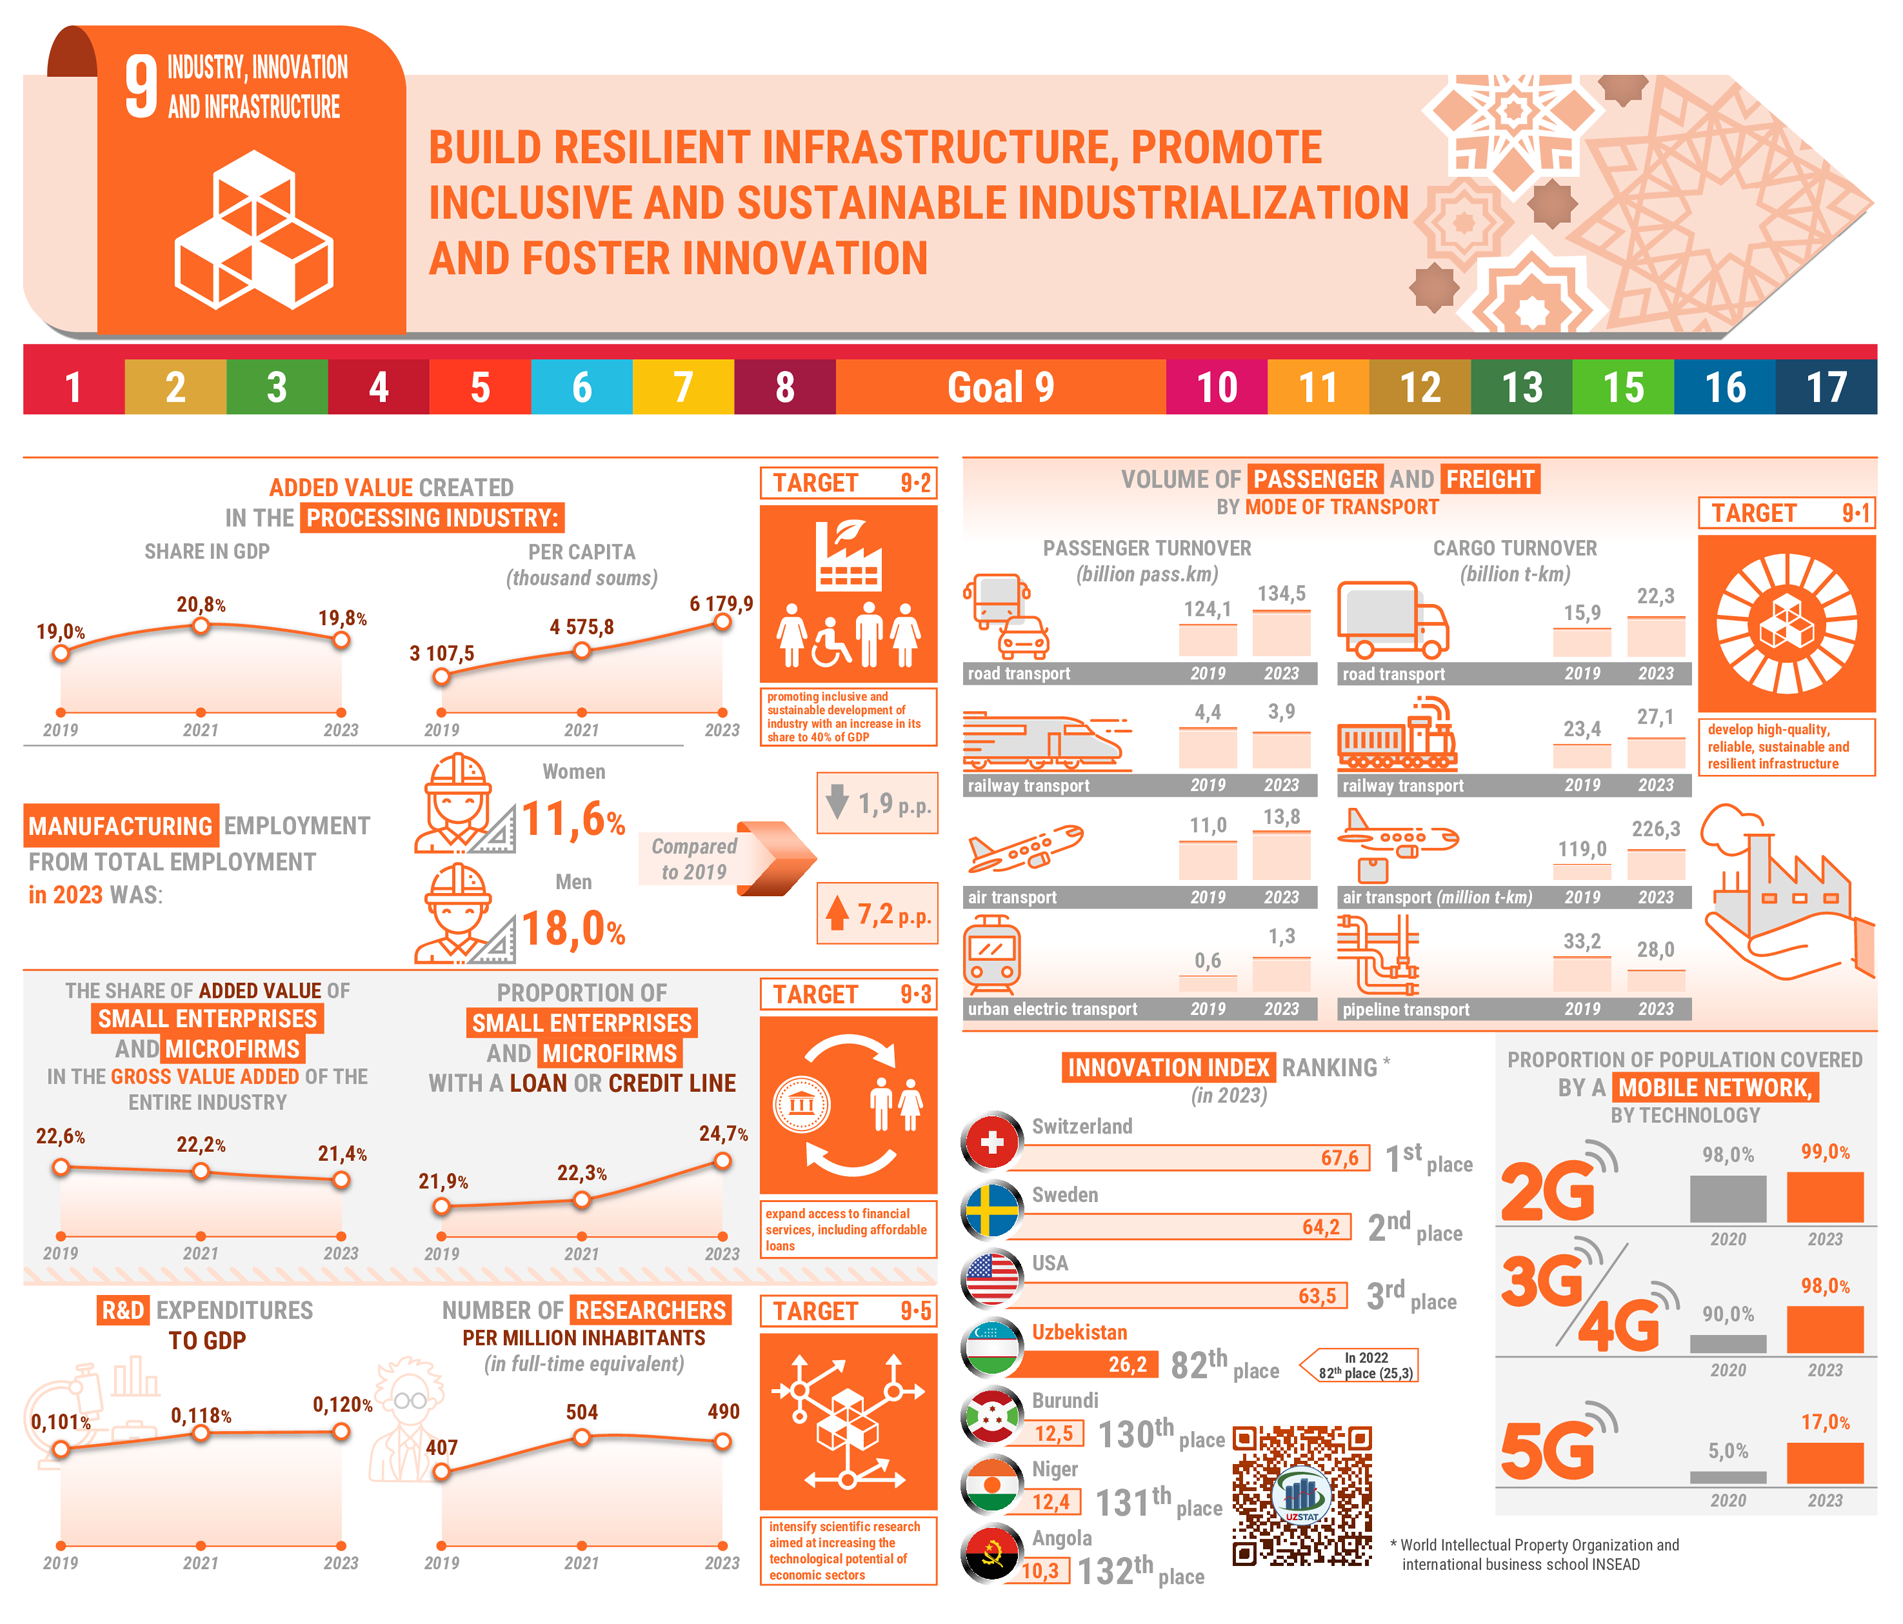
Target 9.1. Develop quality, reliable, sustainable and resilient infrastructure, including territorial and transborder infrastructure, to support economic development and human well-being, with a focus on affordable and equitable access for all.
Target 9.2. Promotion of inclusive and sustainable development of industry, increasing its share in GDP up to 40 per cent by 2030 through advanced development of processing industries, creation of new and modernization of existing enterprises with extensive use of resource-saving and environmentally friendly technologies.
Target 9.3. Increase the access of small-scale industrial enterprises and microfirms to financial services, including affordable loans, and strengthen their integration into value chains and markets.
Target 9.4. By 2030, upgrade infrastructure and retrofit industries to make them sustainable, through increased resource-use efficiency and greater adoption of clean and environmentally sound technologies and industrial processes, with engagement of all interested countries in accordance with their respective capabilities.
Target 9.5. Intensify scientific research aimed at increasing the technological potential of sectors of the economy, including by creating favorable conditions for innovative activities and increasing the number of employees in research and development by 2 times.
Target 9.b. Support development, research and innovation in the field of domestic technologies, including by creating a policy environment that is conducive, in particular, to industrial diversification and increase in two times of value added in the primary industries.
Target 9.с. Significantly increase access to information and communication technology and strive to provide universal and affordable access to the Internet.
National indicators
| № | NATIONAL INDICATORS | 2000 | 2001 | 2002 | 2003 | 2004 | 2005 | 2006 | 2007 | 2008 | 2009 | 2010 | 2011 | 2012 | 2013 | 2014 | 2015 | 2016 | 2017 | 2018 | 2019 | 2020 | 2021 | 2022 | 2023 |
| 1 | Indicator 9.1.2. Volume of passenger and freight by mode of transport: | ||||||||||||||||||||||||
| 1. Passenger turnover, billion pass-km: 9) | |||||||||||||||||||||||||
| a) total; | 30,9 | 31,8 | 33,2 | 36,3 | 40,0 | 46,2 | 49,8 | 56,9 | 64,8 | 70,3 | 83,8 | 92,4 | 100,2 | 106,9 | 113,2 | 120,1 | 126,0 | 130,0 | 135,3 | 140,1 | 118,3 | 137,0 | 146,5 | 153,5 | |
| b) road transport; | 23,3 | 24,3 | 25,8 | 29,0 | 32,5 | 38,6 | 42,2 | 48,4 | 55,9 | 62,1 | 74,5 | 82,5 | 89,3 | 95,5 | 101,9 | 109,1 | 114,9 | 117,7 | 121,6 | 124,1 | 113,2 | 127,9 | 131,0 | 134,5 | |
| c) railway transport; | 2,2 | 2,2 | 2,0 | 2,1 | 2,0 | 2,1 | 2,1 | 2,3 | 2,5 | 2,6 | 2,9 | 3,0 | 3,4 | 3,7 | 3,8 | 3,8 | 4,0 | 4,3 | 4,3 | 4,4 | 1,8 | 3,1 | 3,6 | 3,9 | |
| d) air transport; | 3,9 | 3,7 | 3,9 | 4,0 | 4,5 | 4,6 | 4,7 | 5,4 | 5,6 | 4,9 | 5,8 | 6,2 | 7,0 | 7,2 | 7,0 | 6,8 | 6,7 | 7,5 | 8,8 | 11,0 | 3,0 | 5,3 | 10,9 | 13,8 | |
| e) urban electric transport; | 1,5 | 1,6 | 1,5 | 1,2 | 1,0 | 0,9 | 0,8 | 0,8 | 0,8 | 0,6 | 0,6 | 0,6 | 0,5 | 0,5 | 0,5 | 0,4 | 0,4 | 0,5 | 0,6 | 0,6 | 0,3 | 0,8 | 1,0 | 1,3 | |
| 2. Cargo turnover, billion tons-km: 9) | |||||||||||||||||||||||||
| a) total; | 54,6 | 55,6 | 59,9 | 63,1 | 64,7 | 68,9 | 73,4 | 78,8 | 83,8 | 77,8 | 60,4 | 62,6 | 66,4 | 65,8 | 66,2 | 65,8 | 65,3 | 66,9 | 71,3 | 72,6 | 66,9 | 74,8 | 75,5 | 77,6 | |
| b) road transport; | 8,9 | 8,7 | 9,0 | 9,7 | 11,0 | 13,8 | 16,1 | 18,2 | 21,0 | 23,2 | 9,1 | 9,9 | 10,5 | 11,2 | 11,9 | 12,8 | 13,3 | 13,6 | 14,6 | 15,9 | 16,2 | 19,1 | 20,5 | 22,3 | |
| c) railway transport; | 15,0 | 15,7 | 18,4 | 18,9 | 18,0 | 18,1 | 19,3 | 21,6 | 23,4 | 24,2 | 22,3 | 22,5 | 22,7 | 22,9 | 22,9 | 22,9 | 22,9 | 22,9 | 22,9 | 23,4 | 23,6 | 24,6 | 25,0 | 27,1 | |
| d) air transport, million tons-km; | 120,1 | 96,4 | 126,4 | 95,3 | 117,3 | 97,8 | 77,1 | 76,7 | 84,0 | 102,9 | 168,0 | 162,5 | 121,9 | 116,3 | 125,1 | 131,1 | 132,2 | 156,9 | 123,5 | 119,0 | 219,0 | 303,5 | 322,5 | 226,3 | |
| e) pipeline transport. | 30,6 | 31,1 | 32,4 | 34,5 | 35,6 | 36,9 | 38,0 | 39,0 | 39,3 | 30,3 | 28,9 | 30,1 | 33,0 | 31,5 | 31,2 | 30,0 | 28,9 | 30,2 | 33,6 | 33,2 | 26,8 | 30,8 | 29,7 | 28,0 | |
| 2 | Indicator 9.2.1. Manufacturing value added as a proportion of GDP and per capita: 9) | ||||||||||||||||||||||||
| a) share in GDP, percentage; | - | - | - | - | - | - | - | - | - | - | 11,6 | 11,5 | 11,9 | 13,0 | 14,1 | 14,1 | 15,0 | 15,5 | 17,9 | 19,0 | 20,5 | 20,8 | 20,3 | 19,8 | |
| b) per capita, thousand soums. | - | - | - | - | - | - | - | - | - | - | 281,4 | 360,5 | 451,5 | 588,8 | 770,7 | 905,9 | 1095,1 | 1541,1 | 2321,6 | 3107,5 | 3732,8 | 4575,8 | 5326,3 | 6179,9 | |
| 3 | Indicator 9.2.2. Manufacturing employment as a proportion of total employment: 16) | - | - | - | - | - | - | - | - | - | - | 11,5 | 11,5 | 11,4 | 11,4 | 11,3 | 11,3 | 11,3 | 11,8 | 12,0 | 11,9 | 12,1 | 12,1 | 11,9 | 15,4 |
| a) women; | - | - | - | - | - | - | - | - | - | - | - | - | - | - | - | - | 11,7 | 12,3 | 13,1 | 13,5 | 13,5 | 13,5 | 13,1 | 11,6 | |
| b) men. | - | - | - | - | - | - | - | - | - | - | - | - | - | - | - | - | 11 | 11,4 | 11,3 | 10,8 | 11,1 | 11,2 | 11,1 | 18 | |
| 4 | Indicator 9.3.1.1. The share of added value of small enterprises and microfirms in the gross value added of the entire industry (percentage). | - | - | - | - | - | - | - | - | - | - | 28,9 | 30,3 | 29,9 | 33,9 | 36,5 | 41,1 | 42,7 | 39,4 | 34,6 | 22,6 | 24,0 | 22,2 | 20,4 | 21,4 |
| 5 | Indicator 9.3.2. Proportion of small enterprises and micro-firms with a loan or credit line. | - | - | - | - | - | - | - | - | - | - | - | - | - | - | - | - | - | - | - | 21,9 | 22,2 | 22,3 | 22,7 | 24,7 |
| 6 | Indicator 9.4.1. CO2 emissions per unit of value added. 17) | 1,54 | 1,47 | 1,45 | 1,33 | 1,21 | 1,08 | 1,04 | 0,94 | 0,9 | 0,83 | 0,72 | 0,7 | 0,65 | 0,54 | 0,52 | 0,47 | 0,44 | 0,45 | - | - | - | - | - | - |
| 7 | Indicator 9.5.1. Research and development expenditure as a proportion of GDP. 9) | 0,36 | 0,35 | 0,29 | 0,27 | 0,27 | 0,24 | 0,22 | 0,22 | 0,19 | 0,20 | 0,16 | 0,16 | 0,16 | 0,16 | 0,16 | 0,17 | 0,18 | 0,13 | 0,11 | 0,10 | 0,13 | 0,12 | 0,14 | 0,12 |
| 8 | Indicator 9.5.2. Researchers (in full-time equivalent) per million inhabitants. | - | - | - | 566 | 546 | 569 | 493 | 470 | 490 | 517 | 534 | 564 | 504 | 497 | 492 | 487 | 495 | 485 | 470 | 407 | 411 | 504 | 522 | 490 |
| 9 | Indicator 9.b.1. Proportion of medium and high-tech industry value added in total value added. 9) | - | - | - | - | - | - | - | - | - | - | 15,8 | 17,1 | 18,0 | 17,5 | 17,6 | 16,0 | 15,2 | 17,7 | 21,3 | 19,0 | 17,2 | 16,9 | 19,1 | 18,8 |
| 10 | Indicator 9.c.1. Proportion of population covered by a mobile network, by technology: | ||||||||||||||||||||||||
| a) on 2-G technology; | - | - | - | - | - | - | - | - | - | - | - | - | - | - | - | - | - | 92,0 | 94,0 | 96,0 | 98,0 | 99,0 | 99,0 | 99,0 | |
| b) on 3-G/4-G technology; | - | - | - | - | - | - | - | - | - | - | - | - | - | - | - | - | - | 35,0 | 48,0 | 70,0 | 90,0 | 95,0 | 98,0 | 98,0 | |
| c) on 5-G technology. | - | - | - | - | - | - | - | - | - | - | - | - | - | - | - | - | - | - | - | - | 5,0 | 8,0 | 12,0 | 17,0 |
9) For individual years, the data have been recalculated
16) According to OKED
17) Indicator 9.4.1 CO2 emissions per unit of value added (calculations of greenhouse gas emissions based on updated preliminary inventory data were carried out in accordance with the new IPCC guidelines).