
Before the pandemic, the incomes of the bottom 40 per cent of the population grew faster than the national average in a majority of countries. The impacts of the pandemic and uneven recoveries in different regions of the world threaten to reverse that trend and further worsen global inequality. Record numbers are being forced to flee conflicts and economic hardship. By mid-2022, 1 in 251 people worldwide was a refugee, the highest proportion ever documented. Achieving Goal 10 requires concerted efforts to address the root causes of wage disparities and unequal access to resources both within and between countries.
In order to prevent a sharp social stratification of society over the years of independence, a set of measures has been taken in Uzbekistan to maintain an optimal level of income differentiation of individual segments of the population.
The results of measures taken in Uzbekistan contributed to a consistent decrease and stabilization at the optimal level of differentiation of incomes of the population. Thus, the income ratio of 10 percent of the most and least well-off strata of the population – the decile ratio – decreased from 21.1 times in 2001 to 6.9 times in 2020. During this period, another indicator of the differentiation of incomes of the population – the quintile coefficient – decreased from 9.9 times in 2001 to 4.5 times in 2020.
The generally accepted indicator in the world of income stratification - the Gini index - decreased over 2001-2020 from 0.395 to 0.276 with the threshold value recommended by the UN of 0.35-0.37 and the optimal level of 0.25-0.26.
At the same time, regional imbalance in socio-economic growth within the country remains an urgent problem. The per capita GDP in Tashkent is 4 times higher than in the Surkhandarya region.
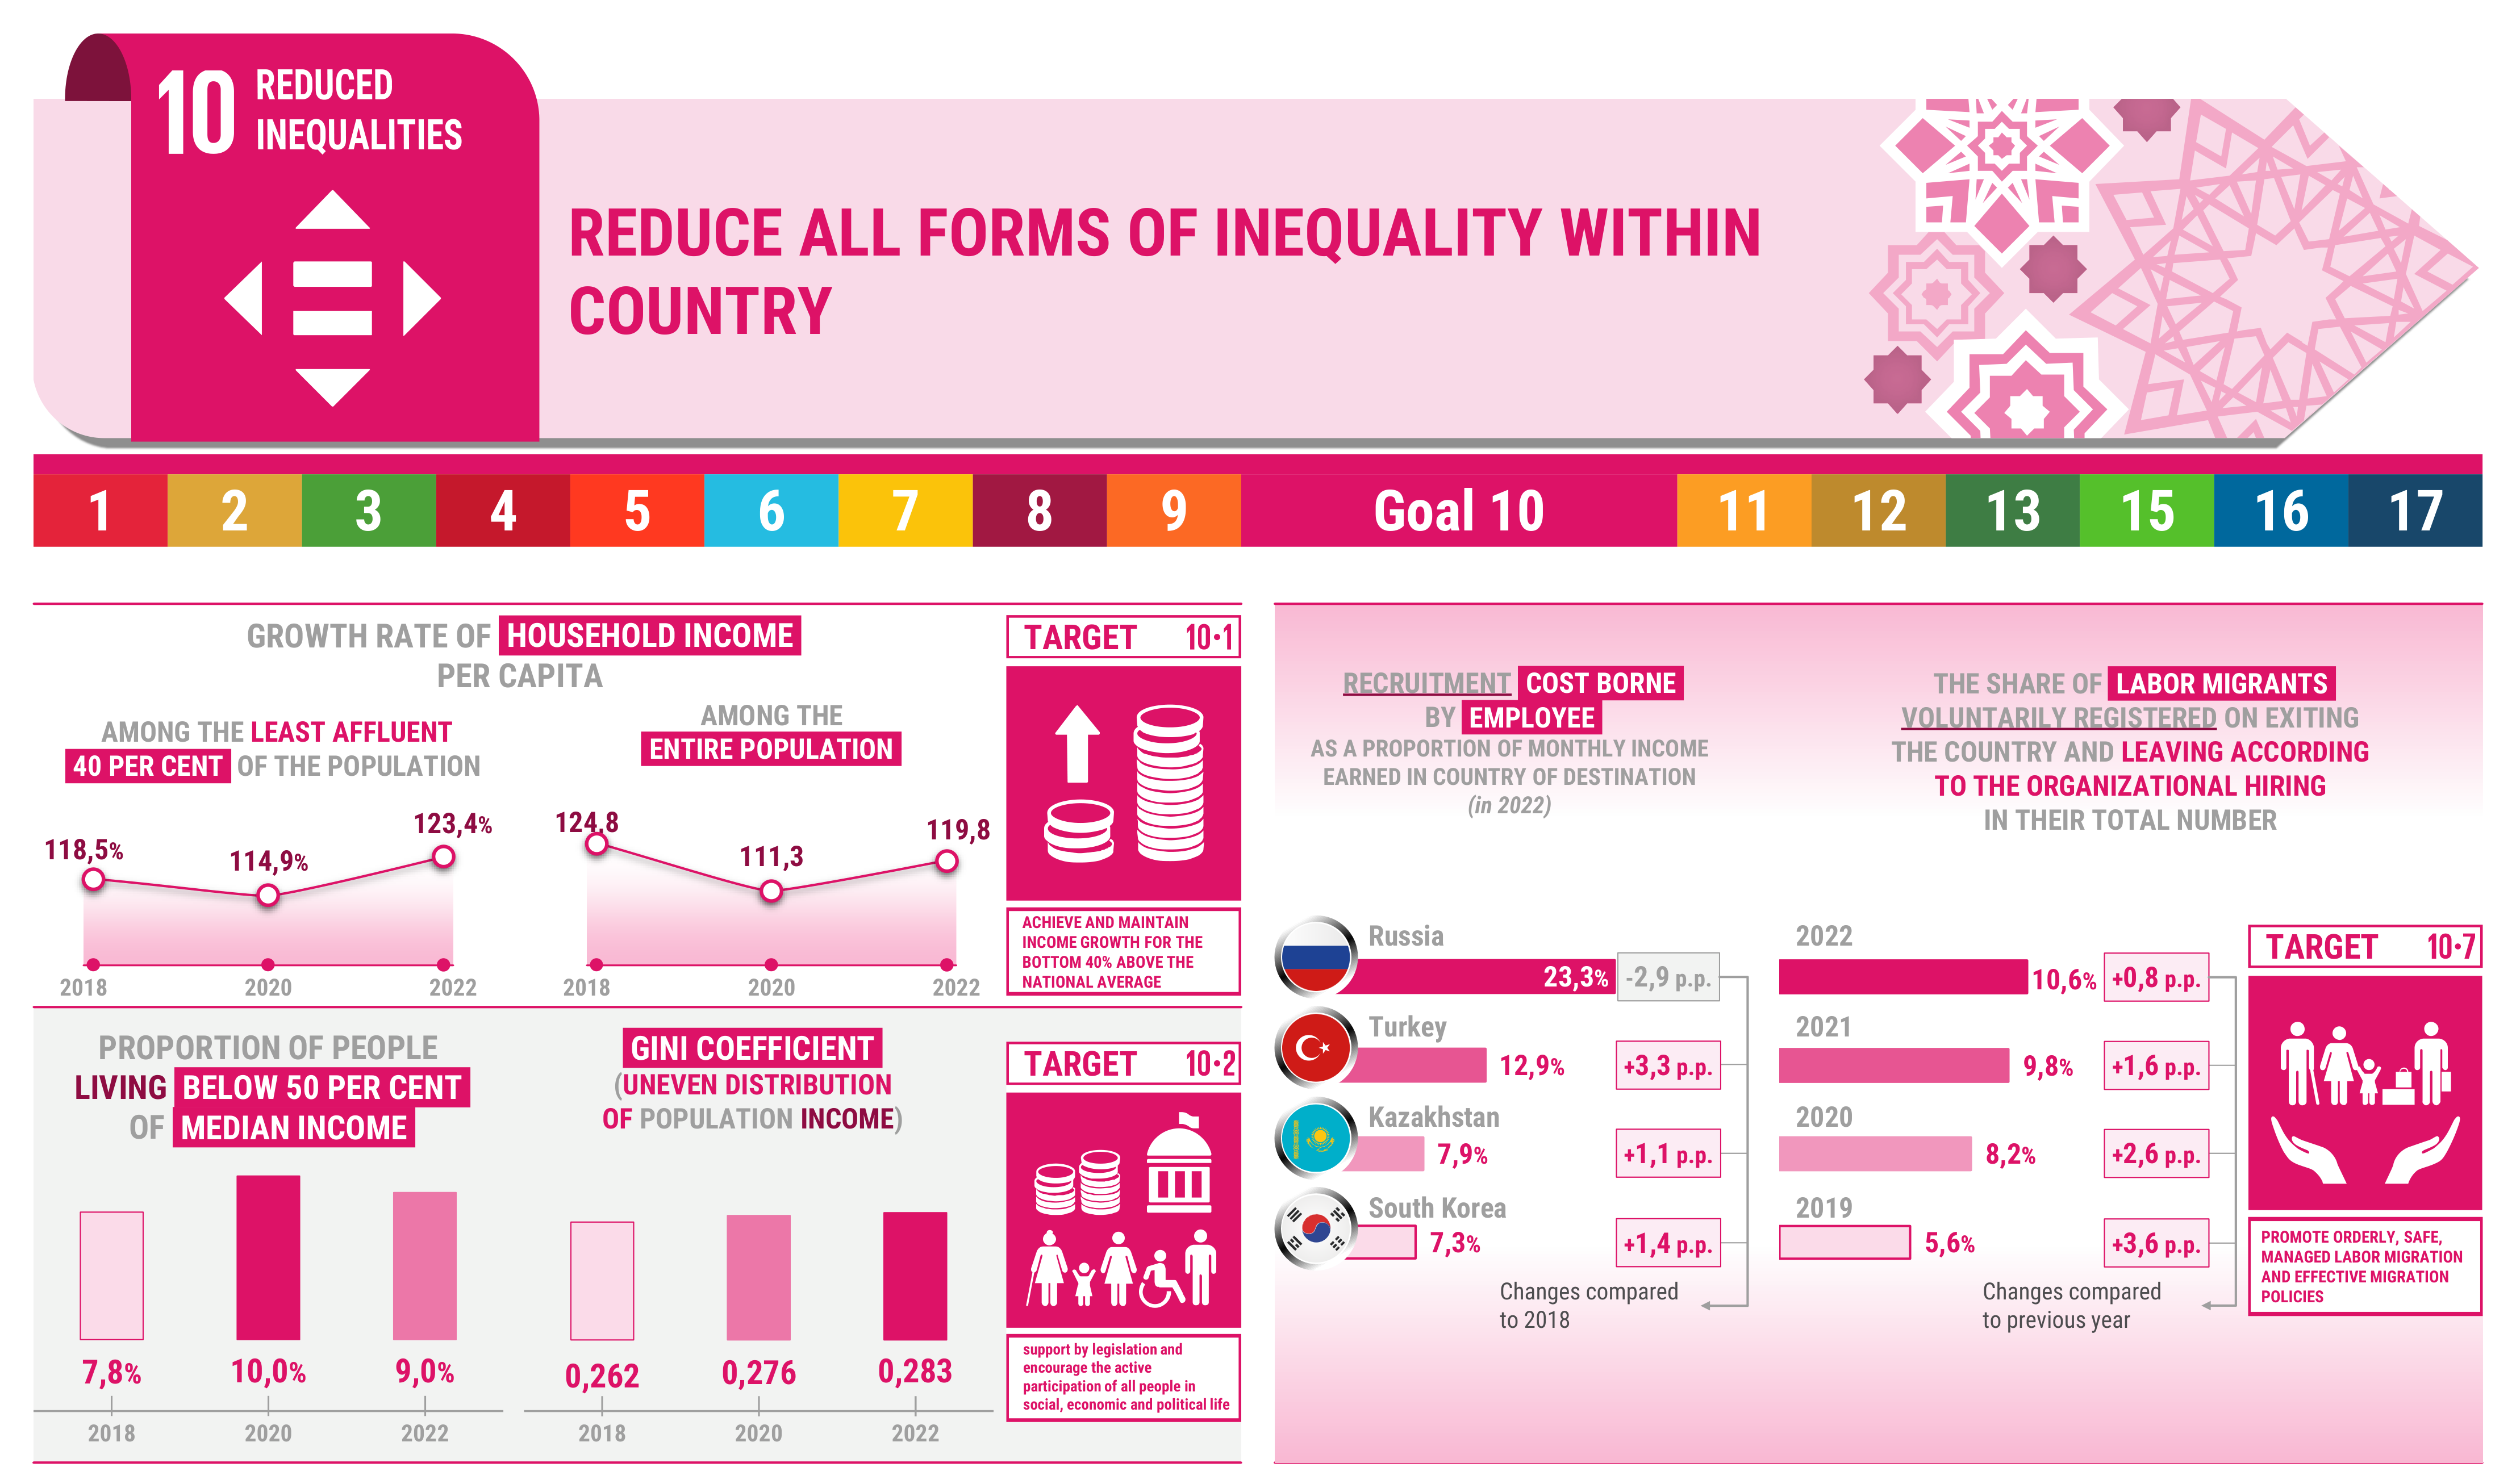
In order to ensure an even distribution of the results of economic growth, Uzbekistan will strive to achieve an income growth rate of the poorest 40 percent of the population at a level exceeding the national average.
National Tasks
Target 10.1. By 2030, progressively achieve and sustain income growth of the bottom 40 per cent of the population at a rate higher than the national average.
Target 10.2. Empower and promote the social, economic and political inclusion of all, irrespective of age, sex, disability, race, ethnicity, origin, religion or social status.
Target 10.3. Ensure complete and rigorous implementation of anti-discrimination norms laws and regulations in practice, especially with regard to people in vulnerable situations.
Target 10.4. Adopt policies, especially fiscal, wage and social protection policies, and progressively achieve greater equality.
Target 10.7. Facilitate orderly, safe, regulated labour migration and effective migration policy.
National indicators
| NATIONAL INDICATORS | 2000 | 2001 | 2002 | 2003 | 2004 | 2005 | 2006 | 2007 | 2008 | 2009 | 2010 | 2011 | 2012 | 2013 | 2014 | 2015 | 2016 | 2017 | 2018 | 2019 | 2020 | 2021 | 2022 | |
| 1 | Indicator 10.1.1. Growth rates of household expenditure or income per capita among the bottom 40 per cent of the population and the total population (percentage). | |||||||||||||||||||||||
| a) the growth rate of household income per capita among the least affluent 40 per cent of the population; | - | - | - | - | - | 136,8 | 131,6 | 136,6 | 142,7 | 146,2 | 148,2 | 148,1 | 140,7 | 136,9 | 138,3 | 135,6 | 125,6 | 119,0 | 118,5 | 116,9 | 114,9 | 122,4 | 123,4 | |
| b) growth rate of household income per capita among the entire population. | 155,8 | 149,8 | 142,4 | 123,4 | 117,3 | 124,8 | 131,5 | 128,4 | 133,5 | 132,5 | 129,2 | 133,6 | 119,6 | 119,2 | 114,0 | 113,7 | 114,9 | 117,7 | 124,8 | 119,3 | 111,3 | 122,7 | 119,8 | |
| 2 | Indicator 10.2.1. Proportion of people living below 50 per cent of median income, age, by sex. | 25,8 | 21,9 | 21,0 | 22,0 | 22,2 | 22,3 | 21,4 | 14,9 | 16,5 | 15,9 | 12,7 | 11,5 | 11,6 | 11,0 | 8,8 | 8,6 | 8,2 | 8,1 | 7,8 | 9,1 | 10,0 | 10,7 | 9,0 |
| 3 | Indicator 10.3.1. Proportion of population reporting having personally felt discriminated against or harassed in the previous 12 months on the basis of a ground of discrimination prohibited under international human rights law. 6) | - | - | - | - | - | - | - | - | - | - | - | - | - | - | - | - | - | - | - | - | - | - | 9,5 |
| 4 | Indicator 10.4.1. Percentage of wages of employees as a percentage of GDP. 8) | 35,1 | 34,7 | 33,6 | 31,7 | 29,8 | 30,7 | 29,8 | 29,9 | 29,0 | 29,2 | 24,7 | 24,8 | 26,8 | 27,3 | 25,8 | 25,3 | 25,3 | 22,5 | 22,4 | 24,8 | 24,6 | 25,3 | - |
| 5 | Indicator 10.7.1. Recruitment cost borne by employee as a proportion of monthly income earned in country of destination: | |||||||||||||||||||||||
| Russia; | - | - | - | - | - | - | - | - | - | - | - | - | - | - | - | - | - | 24,8 | 26,2 | 27,4 | 22,0 | 24,9 | 23,3 | |
| Kazakhstan; | - | - | - | - | - | - | - | - | - | - | - | - | - | - | - | - | - | 6,7 | 6,8 | 7,0 | 5,0 | 11,7 | 7,9 | |
| Turkey; | - | - | - | - | - | - | - | - | - | - | - | - | - | - | - | - | - | 9,1 | 9,6 | 9,8 | 8,3 | 14,6 | 12,9 | |
| South Korea. | - | - | - | - | - | - | - | - | - | - | - | - | - | - | - | - | - | 6,7 | 5,9 | 6,1 | 8,8 | 11,7 | 7,3 | |
| 6 | Indicator 10.7.2. The share of labor migrants voluntarily registered on exiting the country and leaving according to the organizational hiring in their total number (percentage). | - | - | - | - | - | - | - | - | - | - | - | - | - | - | - | - | - | 0,15 | 2,0 | 5,6 | 8,2 | 9,8 | 10,6 |
1) For individual years, the data have been recalculated